https://github.com/takp/bayesian-linear-regression
Sample program to model the data by (normal) linear regression and Bayesian lineaer regression.
https://github.com/takp/bayesian-linear-regression
bayesian-lineaer-regression linear-regression
Last synced: 9 months ago
JSON representation
Sample program to model the data by (normal) linear regression and Bayesian lineaer regression.
- Host: GitHub
- URL: https://github.com/takp/bayesian-linear-regression
- Owner: takp
- Created: 2014-11-24T11:40:58.000Z (over 11 years ago)
- Default Branch: master
- Last Pushed: 2014-11-24T12:43:29.000Z (over 11 years ago)
- Last Synced: 2023-08-06T04:09:10.714Z (almost 3 years ago)
- Topics: bayesian-lineaer-regression, linear-regression
- Language: Python
- Size: 211 KB
- Stars: 10
- Watchers: 5
- Forks: 5
- Open Issues: 1
-
Metadata Files:
- Readme: README.md
Awesome Lists containing this project
README
# Bayesian Linear Regression
Sample program to model the data by (normal) linear regression and Bayesian lineaer regression.
And show the graph to compare those two.
### Environment
- Python 2.7.6
- Numpy
- Matplotlib
### Run
$ python bayesian_lr.py
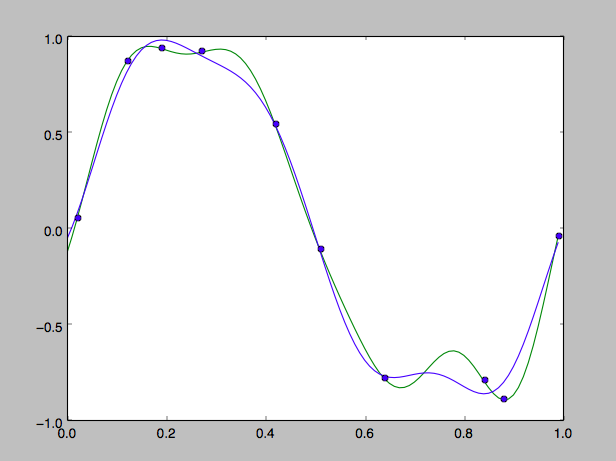
### Graph
- Green: Normal linear regression
- Blue: Bayesian linear regression
### Logic
The function is as following in general :
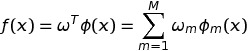
Use the "Gaussian distribution" as the basis function.
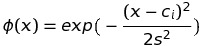
Assuming s = 0.1, c_i = [0.0, 0.1, ..., 1.0].
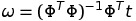
**(1) Normal linear regression**
These "omega" can be solved by this equation.
**(2) Bayesian linear regression**
The posterior distribution is expressed as following.

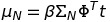
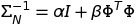
The posterior distribution is Gaussian distribution, so the most possible value is :

So, it is possible to figure out the function by calculating Mu_N.
This time, I assume alpha = 0.1, beta = 9.0.
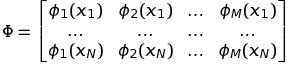
Phi is the matrix as following.
### Numpy
- numpy.linalg.solve : Sove a linear matrix equation.
ref. http://docs.scipy.org/doc/numpy/reference/generated/numpy.linalg.solve.html
- numpy.dot : Scalar product, Inner product
ref. http://docs.scipy.org/doc/numpy/reference/generated/numpy.dot.html
- numpy.linalg.inv :
- numpy.append :
### Reference
(in Japanese) http://gihyo.jp/dev/serial/01/machine-learning/0014?page=1