https://github.com/tanghaibao/treecut
Find nodes in hierarchical clustering that are statistically significant
https://github.com/tanghaibao/treecut
clustering statistical-analysis unsupervised-learning
Last synced: over 1 year ago
JSON representation
Find nodes in hierarchical clustering that are statistically significant
- Host: GitHub
- URL: https://github.com/tanghaibao/treecut
- Owner: tanghaibao
- Created: 2010-02-19T04:52:56.000Z (over 16 years ago)
- Default Branch: master
- Last Pushed: 2017-10-15T01:33:35.000Z (almost 9 years ago)
- Last Synced: 2025-03-18T02:12:22.423Z (over 1 year ago)
- Topics: clustering, statistical-analysis, unsupervised-learning
- Language: Python
- Homepage: http://chibba.agtec.uga.edu/duplication/cut
- Size: 527 KB
- Stars: 28
- Watchers: 2
- Forks: 10
- Open Issues: 3
-
Metadata Files:
- Readme: README.md
Awesome Lists containing this project
README
# TREECUT: Dynamic tree cut algorithm
[](https://pypi.python.org/pypi/treecut)
[](https://travis-ci.org/tanghaibao/treecut)
| | |
| --- | --- |
| Author | Haibao Tang ([tanghaibao](https//github.com/tanghaibao)) |
| | Jingping Li ([Jingping](https://github.com/Jingping)) |
| Email | |
| License | [BSD](http://creativecommons.org/licenses/BSD/) |
## Description
Hierarchical clustering is an important tool in mining useful
relationships among multivariate biological data. However, there is no
obvious way to define a set of useful, non-overlapping groups from the
identified hierarchy. Most efforts have focused on different cut-off
values, evaluate the relative strengths of intra- versus inter- group
variances and then heuristically determine a "good" cutoff. This study
introduces a more dynamic approach that extracts clades that are
significantly enriched or different from other clades. Incorporating
phylogenetic information removes the false positives observed in a
conventional analysis thus improves the prediction of trait association.
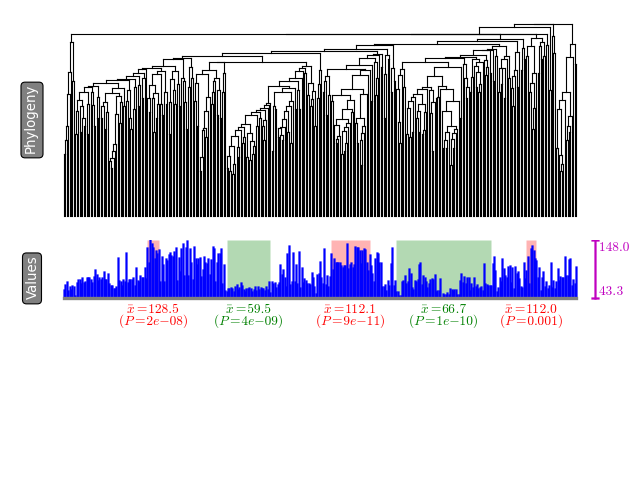
The algorithm takes two inputs, a tree model and some mapping of values
for all the terminal branches. Briefly, the algorithm performs
independent statistical tests on all the internal branches, and
calculates the P-values for each node. At exploratory stage, the
statistical tests are: 1) for quantitative values, test the difference
of two groups separated by each node (student's t-test); 2) for
categorical values, test the association of a particular category for
the descendants of each internal node (Fisher's exact test).
The candidate nodes are determined using the following rule: the P-value
for the candidate node v has to be the smallest among all root-to-leaf
paths that pass v. In other words, the group rooted at node v should
contain the largest level of association, thus avoiding redundant
clades.
## Server version
A server version of TREECUT software can be found here:
## Installation
- Python version >= 2.6
- [scipy](http://www.scipy.org/) for t-test and Fisher's Exact Test
- [ete2](http://ete.cgenomics.org) for parsing the tree structure
```bash
pip install scipy ete2
```
## Usage
Take a look at examples in the `data/` folder: `treefile` and
`listfile`.
The `treefile` should be a
[Newick-formatted](http://en.wikipedia.org/wiki/Newick_format) file
(typically from the output of a phylogenetic reconstruction software,
e.g. [phylip](http://evolution.genetics.washington.edu/phylip.html) or
[MEGA](http://www.megasoftware.net/)).
The `listfile` should contain the quantitative value for each taxon
(separated by comma). Make sure that the taxon names match between
`treefile` and `listfile`:
```
# continuous example
IS13,57.2
IS35,66.13
```
If the data type is discrete, separate the classes by semicolon. For
example:
```
# discrete example
AT1G02150,GO:0009507;GO:0005488
AT1G02160,GO:0005575;GO:0003674;GO:0008150
```
Note that `#` represents a comment line and will be ignored.
To run the software:
```bash
python treecut.py data/tree.nwk data/continuous.csv tree.pdf
```
A summary of extracted modules will be written to `stdout`. Each row
will contain a subclade that show either significantly high phenotypic
value or low phenotypic value. Further a visualization is available as
`tree.pdf` (supported image formats include `svg`, `png`, `pdf`, `jpg`,
etc.). The modules are highlighted in green (low-value modules) and red
(high-value modules) colors.
## Cookbook
There are several immediate applications of TREECUT. Below just show
case two examples, but there are more.
### Extract taxonomic groups with high/low phenotype values
See an example in the `data/` folder. This is the flowering time data
for sorghum diversity panel. `flowering.nwk` is a phylogenetic tree for
the sorghum accessions used in the study. `flowering.assoc` has the
mapping to the accession to the trait values (in this case the number of
days until flowering). To run:
```bash
python treecut.py data/flowering.nwk data/flowering.assoc
```
If you stead want to treat the flowering data as discrete values, say
"high" versus low. You can add a `--discrete` option:
```bash
python treecut.py data/flowering.nwk data/flowering_discrete.assoc --discrete flowering_discrete.png
```
The significant different clades (like extreme trait values) will be
written to the screen.
### Extract co-expressed genes with functional enrichment
In this example, I used Eisen's `CLUSTER` software
([here](http://bonsai.ims.u-tokyo.ac.jp/~mdehoon/software/cluster/software.htm))
to process a series of arabidopsis microarray series
[AtGenExpress](http://www.weigelworld.org/resources/microarray/AtGenExpress/).
After the `CLUSTER` is run. I found two files - `microarray.cdt` and
`microarray.gtr`. The `.gtr` file contains a hierarchical tree
structure, but I need to convert it to `.nwk` format in order for
`treecut.py` to process.
Take a look at `microarray.assoc`, this contains the mapping from
arabidopsis genes to the GO terms, which are based on the information
downloaded at [Gene Ontology
website](http://www.geneontology.org/GO.downloads.annotations.shtml).
Note that a gene can have multiple GO terms associated with it. Here is
the script that I used to create the `microarray.assoc`:
```bash
python scripts/parse_tair_go.py
```
Once everything is set, just run `treecut.py` as usual (make sure to
turn on the `--discrete` option):
```bash
python scripts/eisen_to_newick.py data/microarray.gtr data/microarray.cdt data/microarray.nwk
python treecut.py data/microarray.nwk data/microarray.assoc --discrete
```
The clades that are significantly enriched in certain GO terms will be
written to the screen.
## Reference
Tang et al. TREECUT: algorithm for extracting significant modules from
hierarchical clustering