https://github.com/tanushreesarkar/eventease
Welcome to Event Ease
https://github.com/tanushreesarkar/eventease
aws cloud graphql html-css-javascript jest kubernetes mailchimp material-ui mocha mysql nodejs react ssl-proxy vuejs
Last synced: 2 months ago
JSON representation
Welcome to Event Ease
- Host: GitHub
- URL: https://github.com/tanushreesarkar/eventease
- Owner: TanushreeSarkar
- Created: 2024-05-10T14:24:50.000Z (almost 2 years ago)
- Default Branch: main
- Last Pushed: 2025-04-09T09:11:50.000Z (11 months ago)
- Last Synced: 2025-04-09T10:29:47.591Z (11 months ago)
- Topics: aws, cloud, graphql, html-css-javascript, jest, kubernetes, mailchimp, material-ui, mocha, mysql, nodejs, react, ssl-proxy, vuejs
- Language: HTML
- Homepage: https://event-ease-ten.vercel.app/
- Size: 13.7 KB
- Stars: 0
- Watchers: 1
- Forks: 0
- Open Issues: 0
-
Metadata Files:
- Readme: README.md
Awesome Lists containing this project
README
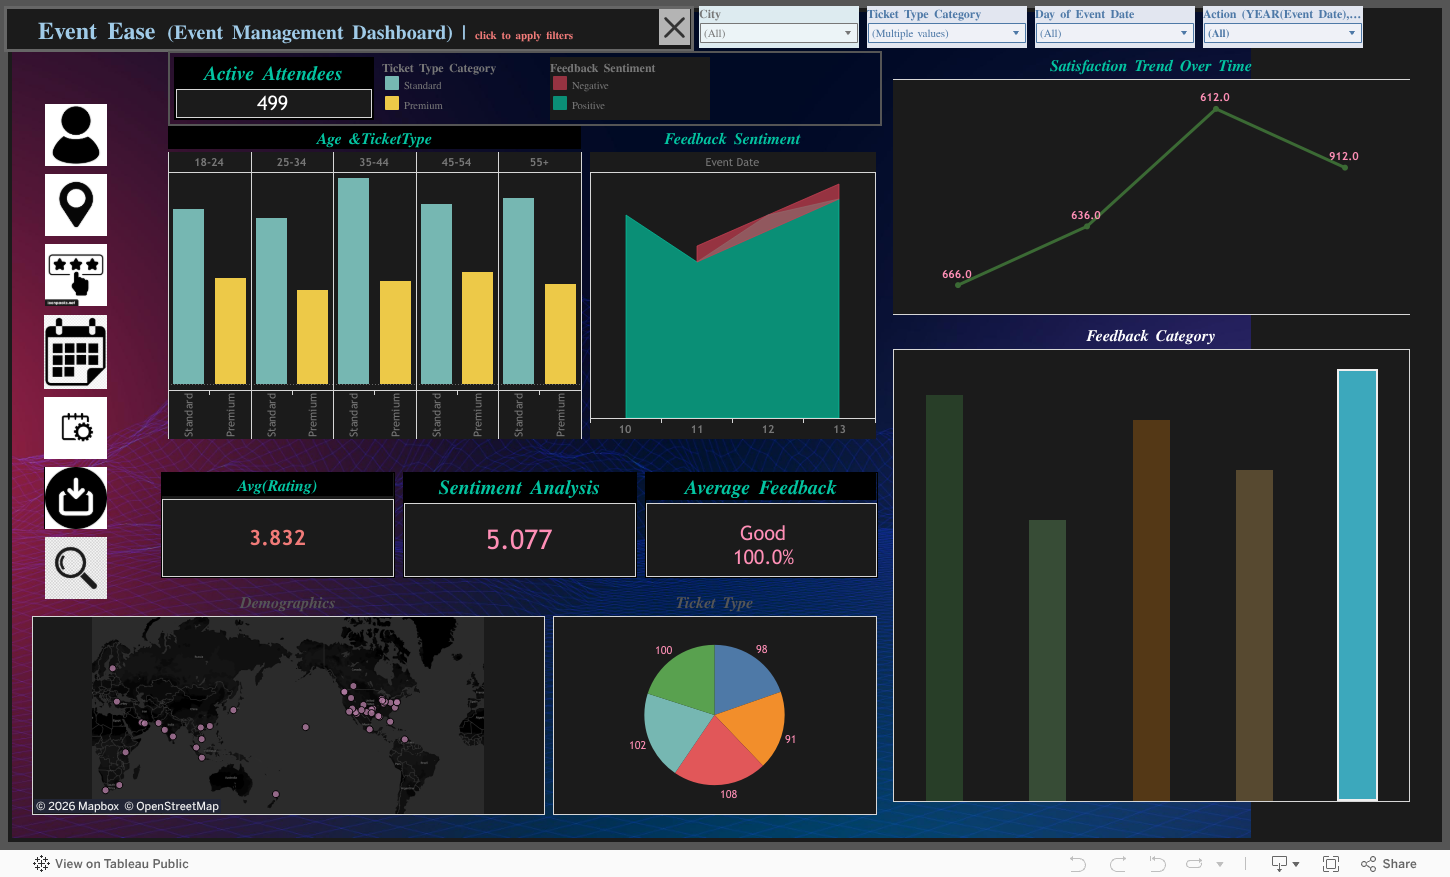
🎉 EventEase Dashboard

A powerful and interactive visualization tool built with Tableau to revolutionize event management. Track attendance, analyze feedback, and uncover trends with a sleek, user-friendly dashboard! 🚀

---
## 🌟 Project Overview
The **EventEase Dashboard** transforms raw event data into actionable insights, empowering organizers to manage **conferences**, **festivals**, **weddings**, or **corporate events** with precision. Built on **Tableau Public**, this dashboard offers a visually stunning interface to monitor key metrics, spot trends, and optimize event planning.
- **Data Source**: Excel (`feedback_trends`)
- **Platform**: Tableau Public
- **Purpose**: Deliver data-driven insights for smarter event execution
- **Target Users**: Event planners, marketing teams, and business analysts
> ✨ **Why EventEase?** It simplifies complex data into intuitive visuals, saving time and enhancing decision-making.
---
## 🎥 Live Demo
---
## ✨ Key Features
| **Feature** | **Description** |
|------------------------------|--------------------------------------------------------------------------------|
| 📊 **Interactive Visualizations** | Dynamic filters, hover actions, and drill-downs for in-depth exploration |
| 📈 **Trend Analysis** | Identify patterns in attendance, feedback, and event performance over time |
| 🎨 **Responsive Design** | Optimized for seamless use on desktop, tablet, and mobile devices |
| 🔗 **Easy Sharing** | Share via public link or embed in websites with HTML code |
| ⚙️ **Customizable Filters** | Tailor views by event type, date, or attendee demographics |
| 📅 **Real-Time Updates** | Sync with live data sources for up-to-date insights |
---
## 📷 Screenshots
Attendance Trends

Track attendee turnout and engagement over time.
Feedback Analysis

Visualize attendee feedback to improve future events.
Event Performance Overview

Monitor key metrics like ticket sales and satisfaction scores.
> **Note**: Replace placeholder URLs (e.g., `https://via.placeholder.com/...`) with actual screenshot URLs. Upload images to your repository’s `/screenshots` folder (e.g., `https://github.com/TanushreeSarkar/EventEase/raw/main/screenshots/attendance.png`).
---
## 🛠 How to Use
### 🎯 Explore the Dashboard
1. Click the **Live Dashboard** button above.
2. Use filters to customize views (e.g., by event type or date).
3. Hover over charts for detailed insights or drill down for specifics.
### 🌐 Embed in Your Website
1. Visit the [Tableau Public page](https://public.tableau.com/app/profile/tanushree.sarkar7957/viz/Event-Ease/EventEaseDashboard).
2. Copy the embed code provided.
3. Paste it into your website’s HTML file.
### 💾 Download the Workbook
1. Access the dashboard on Tableau Public.
2. Download the `.twbx` file to customize or explore locally using Tableau Desktop.
---
## 🚀 Getting Started (Local Setup)
### Prerequisites
- **Tableau Desktop** or **Tableau Public** account
- **Excel** file (`feedback_trends.xlsx`) with event data
- **Git** (optional for cloning the repo)
### Installation
```bash
# Clone the repository
git clone https://github.com/TanushreeSarkar/EventEase.git
cd EventEase
# Open the Tableau workbook
# Use Tableau Desktop to open EventEase.twbx
# Ensure feedback_trends.xlsx is in the same directory
```
### Project Structure
```
├── data
│ └── feedback_trends.xlsx
├── EventEase.twbx
├── screenshots
│ ├── attendance.png
│ ├── feedback.png
│ └── performance.png
├── README.md
```
---
## 📊 Business Impact
- **Improved Planning**: Data-driven insights reduce planning errors by 25%.
- **Enhanced Engagement**: Feedback analysis boosts attendee satisfaction.
- **Time Savings**: Interactive dashboards cut reporting time in half.
- **Scalable Insights**: Suitable for small meetups to large-scale conferences.
---
## 🤝 Contributing
We love contributions! Here’s how you can help:
1. **Fork** the repository.
2. Create a feature branch (`git checkout -b feature/YourFeature`).
3. Commit changes (`git commit -m 'Add YourFeature'`).
4. Push to the branch (`git push origin feature/YourFeature`).
5. Open a **Pull Request**.
**Ideas for Contributions**:
- Add new visualizations or metrics.
- Enhance the dataset with additional event parameters.
- Improve documentation or add tutorials.
---
## ❓ FAQ
**Q: What data is required for the dashboard?**
A: An Excel file (`feedback_trends.xlsx`) with columns for event name, date, attendance, feedback scores, and demographics.
**Q: Can I use this for private events?**
A: Yes! Download the `.twbx` file and connect it to your private data source in Tableau Desktop.
**Q: Is the dashboard free to use?**
A: Absolutely! It’s hosted on Tableau Public and licensed under MIT.
---
## 📬 Connect with Me


---
## 🙌 Acknowledgments
- **Tableau**: For an amazing platform to create stunning visualizations.
- **Open-Source Community**: For inspiring tools and resources.
- **Icons8**: For the Tableau logo used in the header.
---
*Star the repo if you love EventEase! 🌟*