https://github.com/tazeg/termchart
A python module to draw ascii line chart in terminal
https://github.com/tazeg/termchart
ascii chart line-chart python3
Last synced: about 1 month ago
JSON representation
A python module to draw ascii line chart in terminal
- Host: GitHub
- URL: https://github.com/tazeg/termchart
- Owner: Tazeg
- License: mit
- Created: 2018-09-14T09:47:07.000Z (about 7 years ago)
- Default Branch: master
- Last Pushed: 2018-09-14T12:11:39.000Z (about 7 years ago)
- Last Synced: 2025-07-28T11:34:54.438Z (2 months ago)
- Topics: ascii, chart, line-chart, python3
- Language: Python
- Homepage:
- Size: 37.1 KB
- Stars: 8
- Watchers: 2
- Forks: 0
- Open Issues: 0
-
Metadata Files:
- Readme: README.md
- License: LICENSE
Awesome Lists containing this project
README
### TermChart
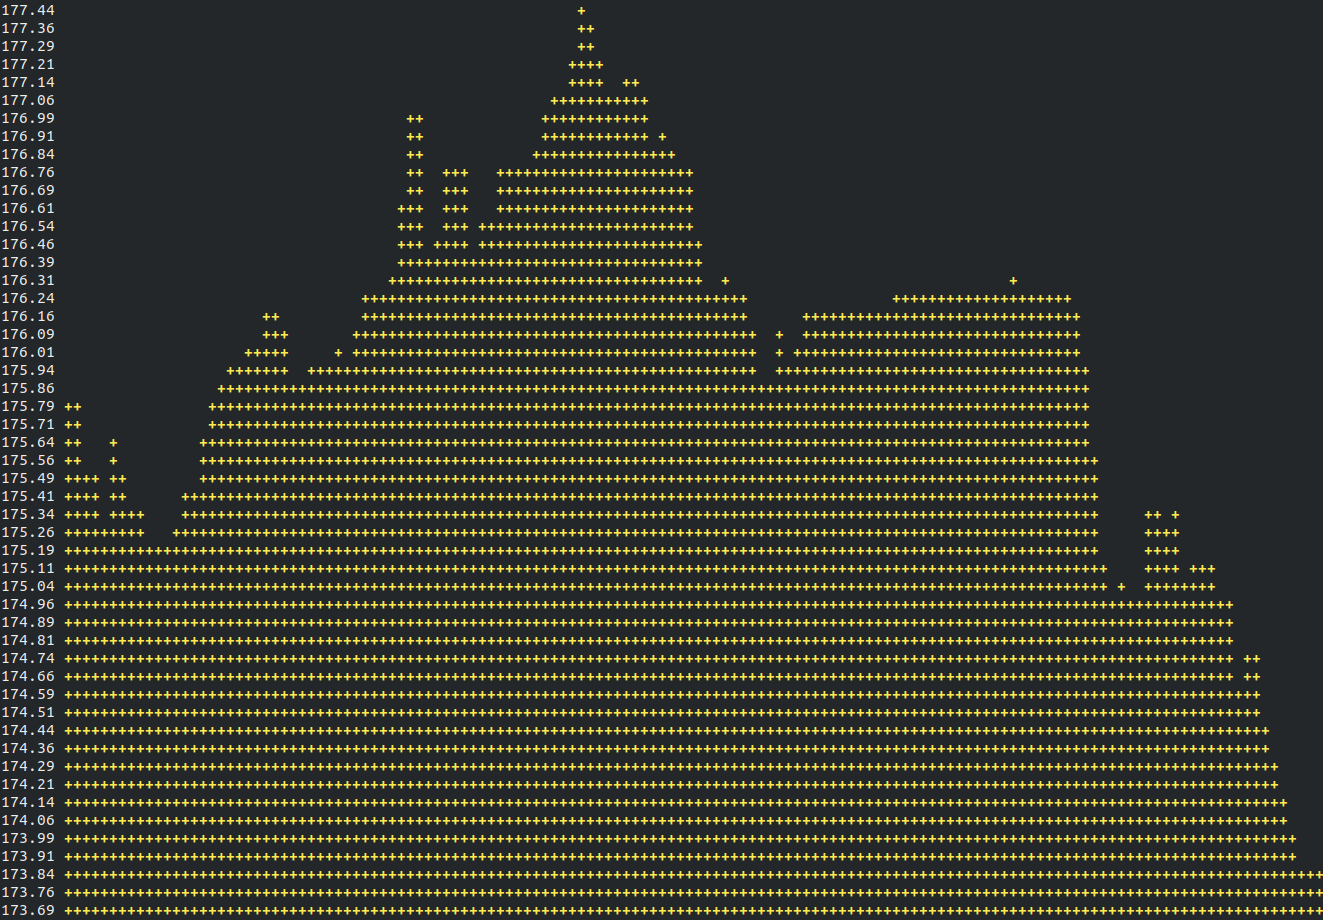
Draw ascii line charts in terminal.
### Install
```bash
pip3 install termchart
```
### Usage
Create a Python file :
```python
import termchart
graph = termchart.Graph([1,2,3,2,5,1,-1,-5,-3])
graph.draw()
```
You can change the plot (default is `+`):
```python
graph.setDot('|')
```
Change the width and height (default cols is 160x50)
```python
graph.setCols(200)
graph.setRows(40)
```
Add values whenever you need it with `addData()`. Here is a full example for a live graph with random values :
```python
import termchart
import time
import os
from random import randint
graph = termchart.Graph([])
while True:
rand = randint(0, 9)
graph.addData(rand)
graph.draw()
time.sleep(1)
os.system('cls' if os.name == 'nt' else 'clear')
```
### Donate