Ecosyste.ms: Awesome
An open API service indexing awesome lists of open source software.
https://github.com/tcp-lab/denumerator
An R package to enumerate the possible categories of genes in a complicated DeSeq experiment
https://github.com/tcp-lab/denumerator
Last synced: about 2 months ago
JSON representation
An R package to enumerate the possible categories of genes in a complicated DeSeq experiment
- Host: GitHub
- URL: https://github.com/tcp-lab/denumerator
- Owner: TCP-Lab
- License: other
- Created: 2024-09-09T13:22:52.000Z (5 months ago)
- Default Branch: main
- Last Pushed: 2024-11-04T10:56:13.000Z (4 months ago)
- Last Synced: 2024-11-08T23:37:22.657Z (3 months ago)
- Language: R
- Size: 573 KB
- Stars: 2
- Watchers: 0
- Forks: 0
- Open Issues: 0
-
Metadata Files:
- Readme: README.md
- License: LICENSE
Awesome Lists containing this project
README
# DeNumeration
An R package to enumerate the possible categories of genes in a complicated DeSeq experiment.
This package helps to solve the problem of having to interpret the results of Differential gene expression with complicated design formulas.
Say that you have an experiment where two drugs are given to cells, either on their own or together, and the gene expression is measured.
You would need a design formula of the type `~ drug_one + drug_two + drug_one:drug_two`, which is then very hard to interpret.
This package implements the method described in [this blog post](https://mrhedmad.github.io/blog/posts/on_2d_lm_deas/): we enumerate all the possible cases a gene may fall in, and count them.
Then, we can take each case, one at a time, and consider what they mean.
This package works specifically for DESeq2-powered analyses.
## Installation
From inside R:
```R
# You need DESeq2 installed.
requireNamespace("DESeq2")
# If you don't have devtools, install it
install.packages("devtools")
devtools::install_github("TCP-Lab/DeNumerator")
```
## Usage
Run your DESeq2 analysis as normal, with any formula you need.
Once you have a `DESeq2DataSet` object with the results (i.e. after you call `DESeq2::DESeq()`), you can use DeNumerator.
### Enumerate possible gene categories
First things first, you should use `denumerate` to get a frame with all the genes falling in one of the three possibilities (upregulated, downregulated or not differentially expressed) for each design variable.
> [!IMPORTANT]
> DeNumerator does NOT let you change the default contrasts that DESeq2 provides.
> In other words, you will get exactly the same contrasts as you would get by calling `DESeq2::resultsNames()`.
> It's advised to check what contrasts you get with `DESeq2::resultsNames()` before calling `denumerate`, so you are aware what contrasts you are looking at.
> You can tweak contrasts somewhat in the call to `denumerate`, but what you should really do is make sure that the levels of your factors in the original DESeq2 analysis are in the correct order (i.e. "case", "control") before you use `denumerate`.
> If you don't, the results are not wrong, but your interpretation of them will be wrong: the meaning of the "upregulated" and "downregulated" will be opposite of what you'd expect (e.g. gene 1 is *upregulated in the control samples*, but what you want is *downregulated in the case samples*).
```R
# This is part of the previous analysis...
deseq_object <- DESeq2::DESeq(deseq_dataset)
# Now we start using denumerator!
requireNamespace("DeNumerator")
enum <- DeNumerator::denumerate(deseq_object, alpha = 0.05, fold_change = 1)
```
The `alpha` and `fold_change` arguments are the alpha and fold change thresholds that determine when a coefficient is deemed to be not significant.
You can tweak them to your liking and needs based on your personal analysis.
You can find out more about the arguments of `denumerate` in `?denumerate`.
You might find many of them (especially `new_labels`) particularly useful.
The `enum` object contains the enumeration. We can now use it in different ways.
### Frequency plot of each enumeration
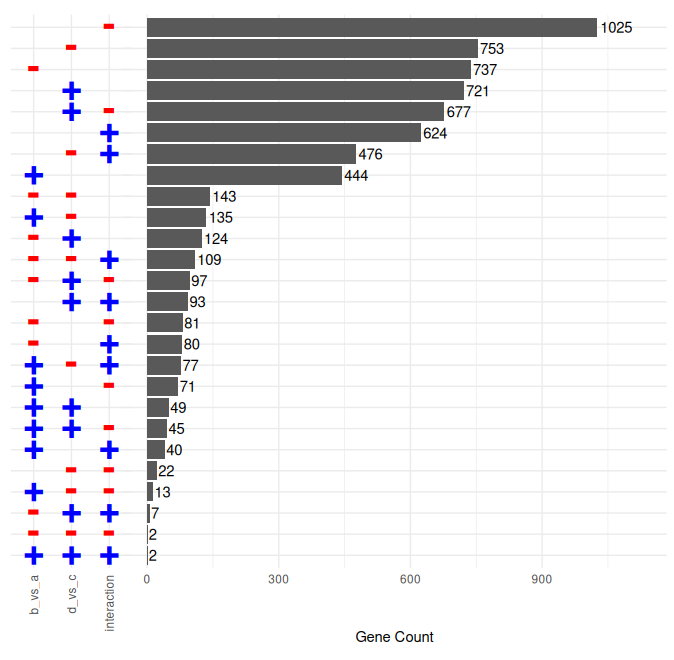
First, we can plot the frequencies of each category of possible combinations of the three values of each variable in the model.
To do this, simply use:
```R
DeNumerator::plot_enumeration_frame(enum)
```
This plot shows the numerosity of each combination of effects.
Here's an example enumeration plot with three variables; `a`, `b`, and their interaction:
Click here to show plot

If you have many possible combinations (each factor in the original formula triplicates the possibilities, as in `3^length(factors)`),
it's advised to use the `top_n` argument to only show the most populated categories.
`plot_enumeration_frame` has many arguments that you can use to tweak the plot to your liking.
It also returns a `ggplot2` object, that you can continue adding layers to or combine (e.g. with the `patchwork` library).
### Getting a list of genes
When you are interested in the actual list of genes from each enumeration, you can take them out of the `enum` object directly with simple R code:
```R
# Assume that the levels in the formula were `cell_type`, `media` and `interaction`
# Though this is not realistic in an actual case (unless you used `new_labels` in the `denumerate` call to rename the contrasts)
genes_of_interest <- row.names(enum)[enum$cell_type == "positive" & enum$media == "negative" & enum$interaction == "zero"]
```
This assumes that the gene names were included in the DESeq2 analysis as row names (as a normal deseq analysis would).
## Getting help
You can find help for each DeNumerator function by using R's internal help (See ?DeNumerator).
If you find a bug, need further help or require a feature, please [open an issue](https://github.com/TCP-Lab/DeNumerator/issues/new).
All issues, especially of bugs, are appreciated.
## Contributing
We welcome contributions. Please see the issues of this repository for things that still need to be done.
To contribute, directly open a pull request with your proposal, and we'll gladly evaluate it.
## Useful Links
- Blog post describing the problem: https://mrhedmad.github.io/blog/posts/on_2d_lm_deas/
- Link to initial implementation of the enumeration solution: https://github.com/TCP-Lab/2212-Fiorio-stiffness/blob/main/src/deseq_dea_exploration.R