Ecosyste.ms: Awesome
An open API service indexing awesome lists of open source software.
https://github.com/telekom/sebastiangunreben-cdf-plugin
Repository holds a grafana panel plugin to visualize cumulative distribution functions (CDF).
https://github.com/telekom/sebastiangunreben-cdf-plugin
cdf grafana grafana-influxdb grafana-panel grafana-plugin
Last synced: 7 days ago
JSON representation
Repository holds a grafana panel plugin to visualize cumulative distribution functions (CDF).
- Host: GitHub
- URL: https://github.com/telekom/sebastiangunreben-cdf-plugin
- Owner: telekom
- License: apache-2.0
- Created: 2021-05-19T08:50:33.000Z (over 3 years ago)
- Default Branch: main
- Last Pushed: 2024-12-03T12:49:41.000Z (about 2 months ago)
- Last Synced: 2025-01-11T18:49:08.343Z (13 days ago)
- Topics: cdf, grafana, grafana-influxdb, grafana-panel, grafana-plugin
- Language: TypeScript
- Homepage:
- Size: 167 KB
- Stars: 1
- Watchers: 2
- Forks: 1
- Open Issues: 1
-
Metadata Files:
- Readme: README.md
- Changelog: CHANGELOG.md
- License: LICENSE
Awesome Lists containing this project
README
# Cumulative Distribution Function (CDF) Panel
If you already know what a CDF is, you may skip the next sections and directly
jump to the bottom to check out the steps to install this plugin.
## What does the CDF panel plugin show?
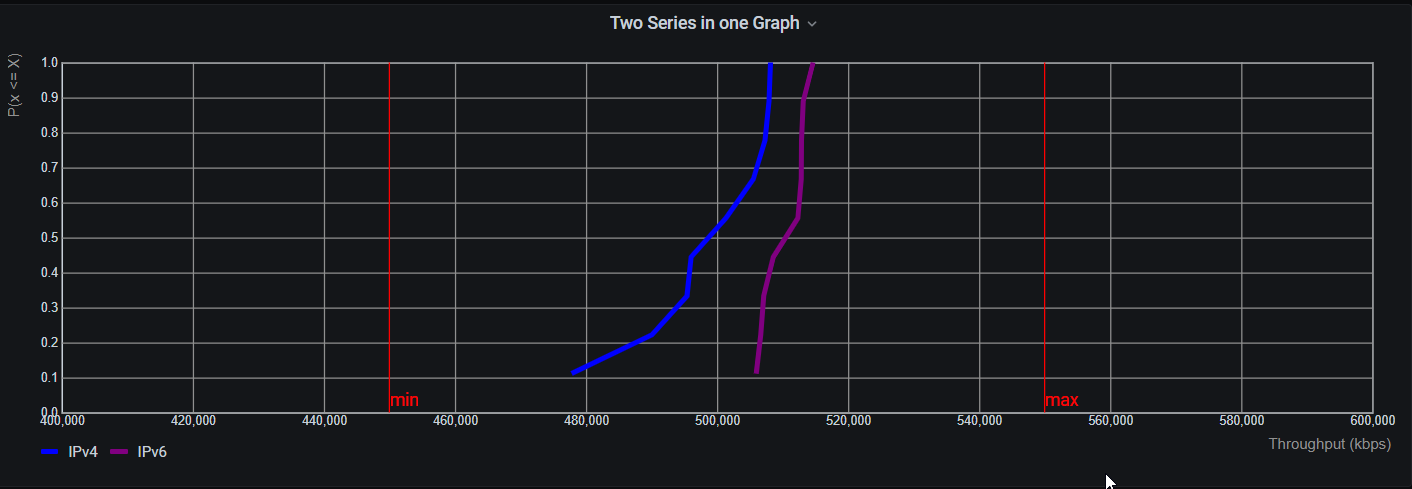
The CDF panel plugin visualizes the (complementary) cumulative distribution of a given series of values.
Statistically speaking, it shows P(x <= X). It shows the frequency/probability P of a certain value "x" to be less than "X".

The CDF may be used to quantify the amount of outliers not fitting into the
expection of the value distribution.

### Example
A query responses with the following series:
| time | value |
| --- |:-----:|
| t1 | 1 |
| t2 | 5 |
| t3 | 3 |
| t4 | 2 |
The time values (t1, t2, t3, t4) are ignored and not processed.
Only relevant are the values 1, 5, 3, 2.
The probability of a value "x" to be less than X=3 is P(x <= 3) = 0.75
as the values 1, 2, 3 are equal or less than 3 and these are 3 out of 4 values.
### Properties
If "x" is less than the smallest value of the series, the probability is zero.
If "x" is larger or equal to the largest value of the seres, the probability is
one.
## How to use this panel?
This panel has been developed together with influxdb.
However, as the series responds with a "number" series, any other db
fulfilling this requirement is fine, too. Per query, the first "number"
field is evaluated.
The panel displays on the x-axis, the value range and on the y-axis the
probability from 0 to 1.
## Config
This panel allows a flavor of config options:
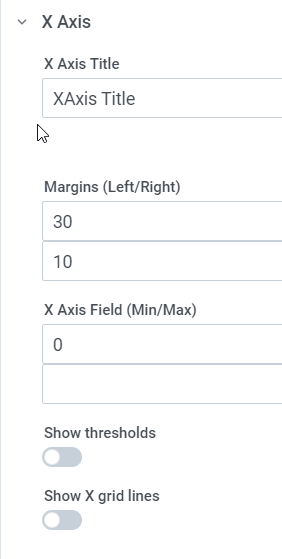
### X-Axis

* Show grid
* Visualize thresholds on x-axis
..* min threshold with value and label
..* max threshold with value and label
* Change title
* Configurable range on x-axis
* Margins for proper vizualization
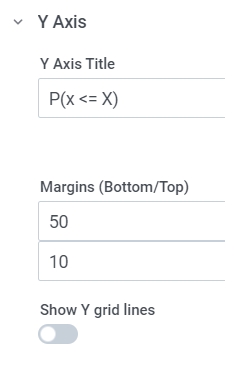
### Y-Axis

* Show grid
* Change title
* Margins for proper vizualization
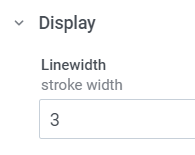
### Display

* Change color per series
* Change stroke witdth
* Change to complementary distribution function 1-P(x <= X).
### Contact
For feature request or bug reporting please use [email protected].
# Learn more
* [Howto install this plugin in Grafana](https://grafana.com/docs/grafana/latest/plugins/installation/)
* [CDF at Wikipedia](https://en.wikipedia.org/wiki/Cumulative_distribution_function)
* [d3js](https://d3js.org/)
* [ReactJS](https://reactjs.org/)
* [TypeScript](https://www.typescriptlang.org/)
# Contact
For feature requests or bug reports, please contact me directly