https://github.com/thakkaryash94/docker-grafana-loki-fluent-bit-sample
Grafana Loki sample with Docker and fluent-bit
https://github.com/thakkaryash94/docker-grafana-loki-fluent-bit-sample
docker fluentd grafana loki
Last synced: 11 days ago
JSON representation
Grafana Loki sample with Docker and fluent-bit
- Host: GitHub
- URL: https://github.com/thakkaryash94/docker-grafana-loki-fluent-bit-sample
- Owner: thakkaryash94
- License: mit
- Created: 2020-05-06T21:05:21.000Z (almost 5 years ago)
- Default Branch: master
- Last Pushed: 2021-01-20T20:39:54.000Z (over 4 years ago)
- Last Synced: 2024-11-07T10:41:12.621Z (6 months ago)
- Topics: docker, fluentd, grafana, loki
- Homepage:
- Size: 558 KB
- Stars: 56
- Watchers: 5
- Forks: 20
- Open Issues: 0
-
Metadata Files:
- Readme: README.md
- License: LICENSE
Awesome Lists containing this project
README
# Docker centralized logging using Fluent Bit, Grafana and Loki
When running micro-services as containers, monitoring becomes very complex and difficult. That's where Prometheus, Grafana come to the rescue. Prometheus collects the metrics data and Grafana helps us to convert those metrics into beautiful visuals. Grafana allows you to query, visualize, and create an alert on metrics, no matter where they are stored. We can visualize metrics like CPU usage, memory usage, containers count, and much more. But there are few things that we can't visualize like container logs, it needs to be in tabular format with text data. For that, we can setup EFK (Elasticsearch + Fluentd + Kibana) stack, so Fluentd will collect logs from a docker container and forward it to Elasticsearch and then we can search logs using Kibana.
Grafana team has released Loki, which is inspired by Prometheus to solve this issue. So now, we don't need to manage multiple stacks to monitor the running systems like Grafana and Prometheus to monitor and EFK to check the logs.
### Grafana Loki
Loki is a horizontally-scalable, highly-available, multi-tenant log aggregation system inspired by Prometheus. It is designed to be very cost-effective and easy to operate. It does not index the contents of the logs, but rather a set of labels for each log stream. It uses labels from the log data to query.
### Fluent Bit
Fluent Bit is an open-source and multi-platform Log Processor and Forwarder which allows you to collect data/logs from different sources, unify and send them to multiple destinations. It's fully compatible with Docker and Kubernetes environments.
### Docker Fluentd logging driver
The Fluentd logging driver sends container logs to the Fluentd collector as structured log data. Then, users can use any of the various output plugins of Fluentd to write these logs to various destinations.
We are going to use Fluent Bit to collect the Docker container logs and forward it to Loki and then visualize the logs on Grafana in tabular View.
### Setup
We need to setup grafana, loki and fluent/fluent-bit to collect the Docker container logs using fluentd logging driver. Clone the sample project from [here](https://github.com/thakkaryash94/docker-grafana-loki-fluent-bit-sample). It contains the below files.
- docker-compose-grafana.yml
- docker-compose-fluent-bit.yml
- fluent-bit.conf
- docker-compose-app.yml
We can combine all the yml files into one but I like it separated by the service group, more like kubernetes yml files. Let's see, what we have in those files.
Before running docker services, we need to create an external network `loki` because our services are in different files, so they will communicate in this network.
```shell
$ docker network create loki
```
**docker-compose-grafana.yml**
This file contains Grafana, Loki, and renderer services. run `docker-compose -f docker-compose-grafana.yml up -d`. This will start 3 containers, grafana, renderer, and Loki, we will use grafana dashboard for the visualization and loki to collect data from fluent-bit service. Now, go to http://localhost:3000/ and you will be able to access the Grafana Dashboard.
**docker-compose-fluent-bit.yml**
We will be using `grafana/fluent-bit-plugin-loki:latest` image instead of a fluent-bit image to collect Docker container logs because it contains Loki plugin which will send container logs to Loki service. For that, we need to pass `LOKI_URL` environment variable to the container and also mounting `fluent-bit.conf` as well for custom configuration.
```yaml
fluent-bit:
image: grafana/fluent-bit-plugin-loki:latest
container_name: fluent-bit
environment:
- LOKI_URL=http://loki:3100/loki/api/v1/push
volumes:
- ./fluent-bit.conf:/fluent-bit/etc/fluent-bit.conf
```
**fluent-bit.conf**
This file contains fluent-bit configuration. Here, for input, we are listening on 0.0.0.0:24224 port and forwarding whatever we are getting to output plugins. We are setting a few Loki configs like LabelKeys, LineFormat, LogLevel, Url. The main key is LabelKeys, using this, we will be able to see the container logs, to make it dynamic, we are setting it so `container_name`, which means when we will be running our services, we need to pass `container_name` in docker-compose file, using that name, we will be able to search and differentiate container logs. We can add as many LabelKeys as we want with a comma(',').
```
[INPUT]
Name forward
Listen 0.0.0.0
Port 24224
[Output]
Name grafana-loki
Match *
Url ${LOKI_URL}
RemoveKeys source
Labels {job="fluent-bit"}
LabelKeys container_name
BatchWait 1
BatchSize 1001024
LineFormat json
LogLevel info
```
Now, let's run it with `docker-compose -f docker-compose-fluent-bit.yml up -d`. This will start fluent-bit container, which will collect the docker container logs and everything that is printed using stdout and forward it to loki service using loki plugin.
**docker-compose-app.yml**
It contains the actual application/server image service. You can ignore this file but we have to add below config in our server to forward container logs to the fluent-bit container. Important parts of the configuration are container_name, logging. `container_name` is the one we will use to filter the container logs from the Grafana Dashboard. In fluent-address, set your fluent-bit host IP address, if you are running locally, it will be your PC ip address.
```yml
container_name: express-app
logging:
driver: fluentd
options:
fluentd-address: FLUENT_BIT_ADDRESS:24224
```
Now, everything is up and running. Let's generate some logs, if you are running docker-compose-app.yml file, then go to http://localhost:4000 and refresh few times, go to http://localhost:4000/test, this will generate some logs.
So from docker container, logs will be sent to fluent-bit container, which will forward them to the Loki container using the Loki plugin. Now, we need to add Loki in Grafana data source, so that Grafana will be able to fetch the logs from Loki and we will be able to see it on the dashboard.
#### Setup Grafana Dashboard
To see the logs on Grafana dashboard, you can follow [YouTube video](https://youtu.be/qE6hEHNH9dE?t=73) or below steps.
1. Open the browser and go to http://localhost:3000, use default values `admin` and `admin` for username and password.
2. Now, go to http://localhost:3000/datasources and select `Loki` from `Logging and document databases` section.
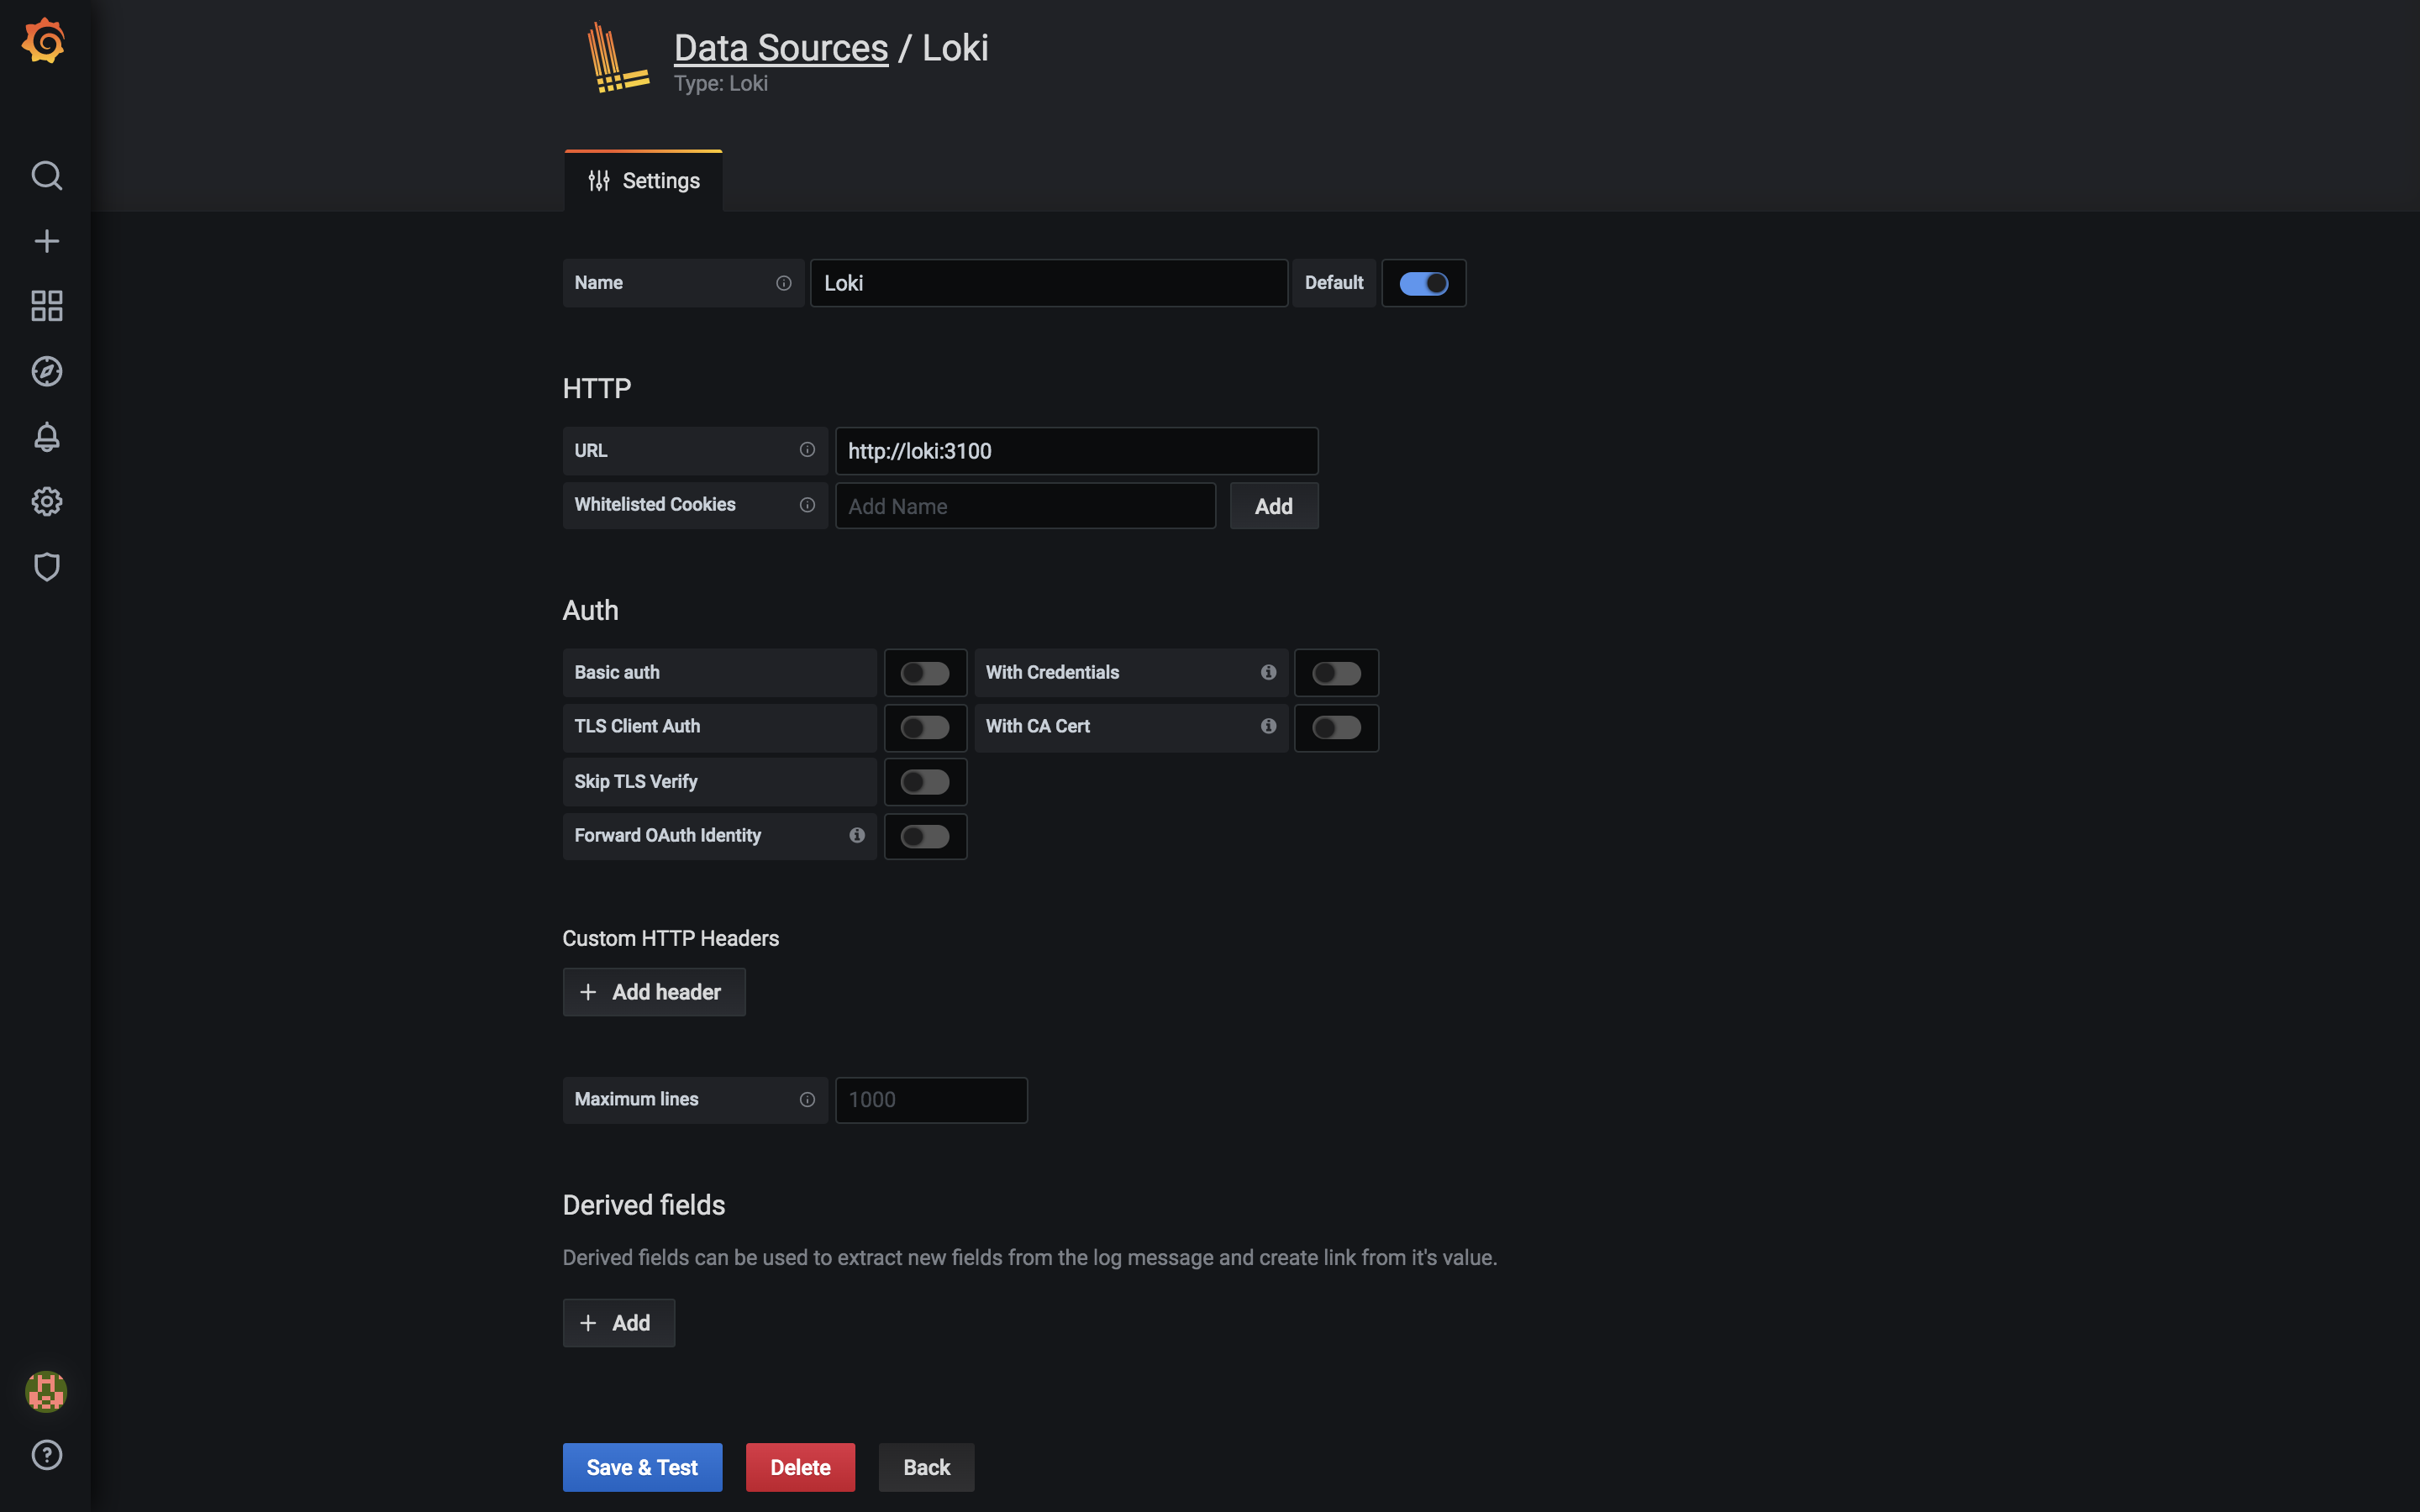
3. Enter `http://loki:3100` in URL under `HTTP` section. We can do this because we are running Loki and Grafana in the same network `loki` else you have to enter host IP address and port here, click on `Save and Test` button from the bottom of the page.

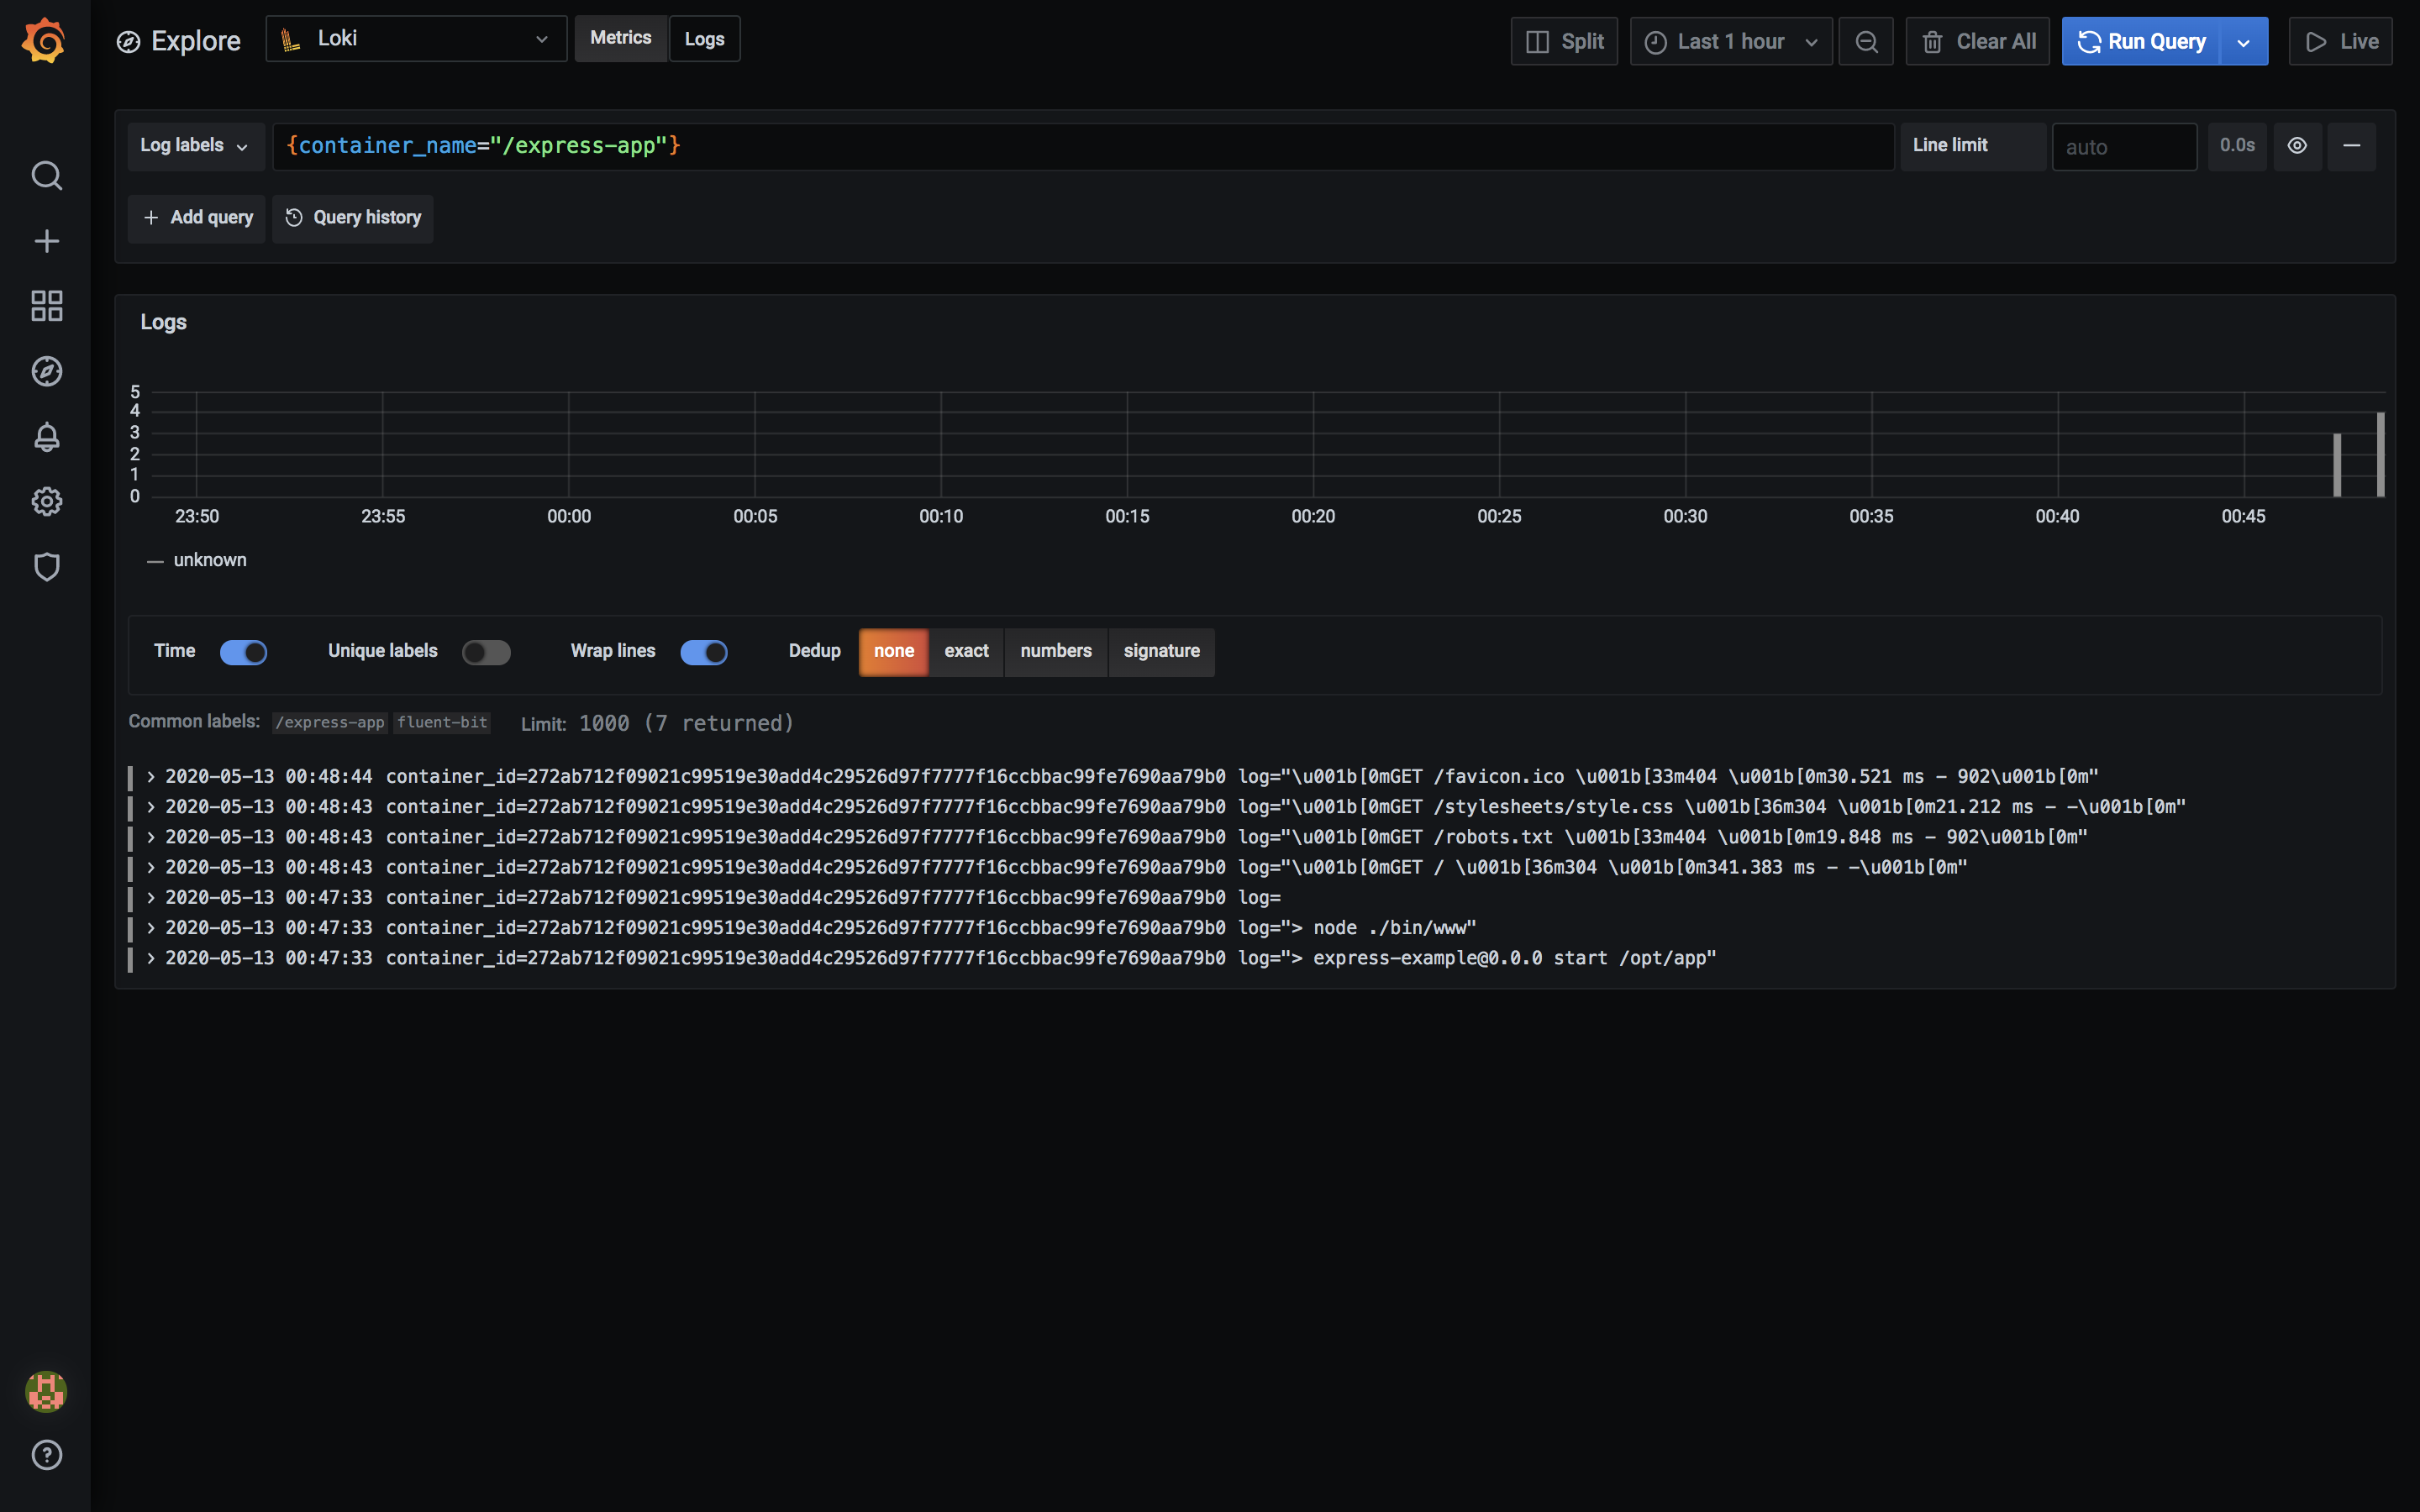
4. Now, go to 3rd tab `Explore` from the left sidebar or http://localhost:3000/explore, click on `Log Labels` dropdown, here you will see `container_name` and `job` labels, these are same labels that we have mentioned in the `fluent-bit.conf` file with `LabelKeys` key.
5. Click on `container_name`, now, you should see our app service container name in the next step else type `{container_name="express-app"}` in the Loki query search. Click on that and that's it, now you should be able to see the container logs, these are the logs that we generated after starting up our app service.

Now, we can tweak the view add this to our Grafana Dashboard and that's it.
So, like this, we have setup fluentd-grafana-loki stack to collect and view the container logs on Grafana Dashboard.
Below are the links that I have mentioned in the blog, that will help you to setup the stack.
Links:
- [GitHub Repo](https://github.com/thakkaryash94/docker-grafana-loki-fluent-bit-sample)
- [Getting started with Grafana Loki - under 4 minutes](https://youtu.be/qE6hEHNH9dE?t=73)
- [Loki GitHub Repo](https://github.com/grafana/loki/tree/master/cmd/fluent-bit)
- [Loki Fluent Bit GitHub Repo](https://github.com/grafana/loki/tree/master/cmd/fluent-bit)