https://github.com/thatsinewave/sinewave-development-statistics
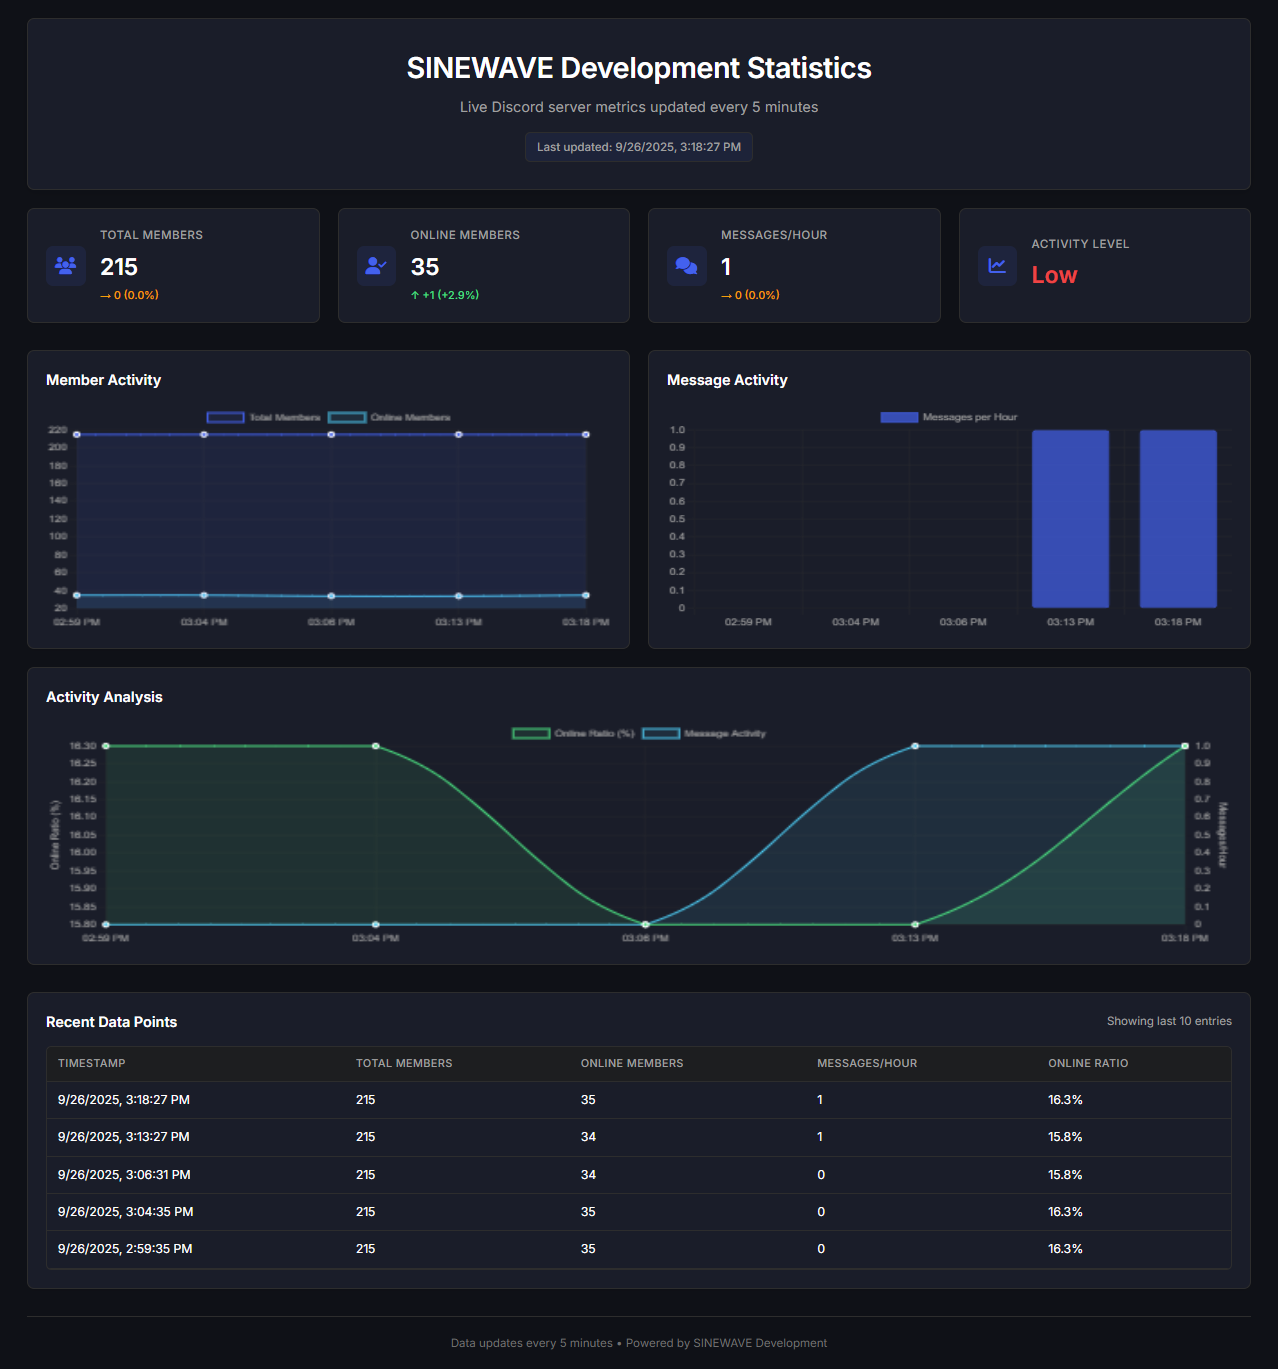
Live statistics about the SINEWAVE Development Discord server updated every 5 minutes
https://github.com/thatsinewave/sinewave-development-statistics
dashboard discord discord-api discord-bot discord-py discordbot discordpy good-first-contribution good-first-issue good-first-issues good-first-pr good-first-pr-first-contribution good-first-project good-first-prs html-css html-css-javascript html-css-js statistics thatsinewave
Last synced: 3 months ago
JSON representation
Live statistics about the SINEWAVE Development Discord server updated every 5 minutes
- Host: GitHub
- URL: https://github.com/thatsinewave/sinewave-development-statistics
- Owner: ThatSINEWAVE
- License: mit
- Created: 2025-09-26T20:25:29.000Z (4 months ago)
- Default Branch: main
- Last Pushed: 2025-10-04T00:05:05.000Z (3 months ago)
- Last Synced: 2025-10-04T00:09:42.704Z (3 months ago)
- Topics: dashboard, discord, discord-api, discord-bot, discord-py, discordbot, discordpy, good-first-contribution, good-first-issue, good-first-issues, good-first-pr, good-first-pr-first-contribution, good-first-project, good-first-prs, html-css, html-css-javascript, html-css-js, statistics, thatsinewave
- Language: Python
- Homepage: https://thatsinewave.github.io/SINEWAVE-Development-Statistics/
- Size: 844 KB
- Stars: 1
- Watchers: 0
- Forks: 0
- Open Issues: 0
-
Metadata Files:
- Readme: README.md
- Contributing: CONTRIBUTING.md
- Funding: .github/FUNDING.yml
- License: LICENSE
- Code of conduct: CODE_OF_CONDUCT.md
- Security: SECURITY.md
Awesome Lists containing this project
README
# SINEWAVE Development Statistics Dashboard
A real-time Discord server statistics dashboard that automatically tracks and displays server metrics with beautiful visualizations and automatic GitHub synchronization.
## Features
### Live Server Metrics
- **Total Members** tracking with change indicators
- **Online Members** count in real-time
- **Messages per Hour** activity monitoring
- **Activity Level** assessment (High/Medium/Low)
- 5-minute automatic updates
### Interactive Visualizations
- **Member Activity Chart** (Total vs Online members)
- **Message Activity Chart** (Messages per hour)
- **Activity Analysis Chart** (Online ratio + message activity)
- Responsive design that works on all devices
### Automated Data Collection
- Discord bot automatically collects statistics every 5 minutes
- Git-based data synchronization to GitHub
- Historical data preservation (up to 7 days of 5-minute intervals)
- Real-time message counting
### Modern Design
- Dark theme with purple/blue accent colors
- Smooth animations and hover effects
- Mobile-responsive layout
- Professional card-based interface
## ☕ [Support my work on Ko-Fi](https://ko-fi.com/thatsinewave)
## Quick Start
### Prerequisites
- Python 3.8+
- Discord Bot Token
- GitHub Personal Access Token
- Discord Server with bot permissions
### Installation
1. **Clone the repository**
```bash
git clone https://github.com/ThatSINEWAVE/SINEWAVE-Development-Statistics.git
cd SINEWAVE-Development-Statistics
```
2. **Set up environment variables**
```bash
cp .env.example .env
# Edit .env with your credentials
```
3. **Configure your `.env` file**
```env
DISCORD_TOKEN=your_discord_bot_token_here
REPO_PATH=./stats-repo
GIT_REPO_URL=https://github.com/ThatSINEWAVE/SINEWAVE-Development-Statistics.git
GIT_USERNAME=YourGitUsername
GIT_EMAIL=your-email@example.com
GITHUB_TOKEN=your_github_personal_access_token_here
```
4. **Install Python dependencies**
```bash
pip install discord.py python-dotenv aiohttp
```
5. **Run the statistics bot**
```bash
python stat-tracker.py
```
# [Join my discord server](https://thatsinewave.github.io/Discord-Redirect/)
### Discord Bot Permissions
Your bot needs the following permissions:
- `View Channels`
- `Read Message History`
- `View Server Insights`
- `See Members`
## Project Structure
```
SINEWAVE-Development-Statistics/
├── index.html # Main dashboard page
├── styles.css # Styling and responsive design
├── script.js # Dashboard functionality and charts
├── stat-tracker.py # Discord bot for data collection
├── server_stats.json # Statistics data (auto-generated)
├── .env.example # Environment variables template
└── README.md # This file
```
## Configuration
### Dashboard Customization
Edit `styles.css` to customize colors:
```css
:root {
--primary: #4361ee; /* Main brand color */
--background: #0f1117; /* Background color */
--card-bg: #1a1d29; /* Card background */
/* ... more variables */
}
```
### Data Collection Settings
Modify the update interval in `script.js`:
```javascript
this.updateInterval = 300000; // 5 minutes (in milliseconds)
```
## Deployment
### GitHub Pages Deployment
1. Push your code to GitHub
2. Enable GitHub Pages in repository settings
3. Set source to `main` branch (or `gh-pages`)
The dashboard is available at:
**https://thatsinewave.github.io/SINEWAVE-Development-Statistics/**
### Bot Deployment
For 24/7 data collection, deploy the bot to:
- Heroku
- DigitalOcean
- AWS EC2
- Raspberry Pi
## Data Points Collected
The bot automatically tracks:
- **Total Members**: Server member count
- **Online Members**: Non-bot members with online status
- **Messages per Hour**: Real-time message activity
- **Timestamp**: When data was collected
## Troubleshooting
### Common Issues
**Bot can't read messages:**
- Ensure bot has "Read Message History" permission
- Check channel-specific permissions
**Git synchronization fails:**
- Verify GitHub token has repo permissions
- Check internet connectivity
- Ensure repository exists and is accessible
**Charts not loading:**
- Check browser console for errors
- Verify Chart.js is loading correctly
- Ensure JSON data is properly formatted
### Logs and Monitoring
The bot provides detailed console logs for:
- Data collection status
- Git operations
- Error reporting
- Performance metrics
## Contributing
Contributions are welcome! Please feel free to submit pull requests for:
- New chart types
- Additional metrics
- UI improvements
- Performance optimizations
**Technologies Used:**
- [Chart.js](https://www.chartjs.org/) for data visualizations
- [Discord.py](https://discordpy.readthedocs.io/) for bot functionality
- [Font Awesome](https://fontawesome.com/) for icons
- [Inter Font](https://fonts.google.com/specimen/Inter) for typography
## 📄 License
This project is open source and available under the [MIT License](LICENSE).