https://github.com/thecodetraveler/createinteractivecharts
An iOS and Android sample app written in Xamarin.Forms, demonstrating how to create interactive charts using Syncfusion
https://github.com/thecodetraveler/createinteractivecharts
charts syncfusion walkthrough xamarin xamarin-android xamarin-forms xamarin-ios
Last synced: about 1 month ago
JSON representation
An iOS and Android sample app written in Xamarin.Forms, demonstrating how to create interactive charts using Syncfusion
- Host: GitHub
- URL: https://github.com/thecodetraveler/createinteractivecharts
- Owner: TheCodeTraveler
- License: mit
- Created: 2020-01-30T21:13:34.000Z (over 6 years ago)
- Default Branch: master
- Last Pushed: 2021-06-30T02:02:16.000Z (almost 5 years ago)
- Last Synced: 2025-02-14T05:31:19.195Z (over 1 year ago)
- Topics: charts, syncfusion, walkthrough, xamarin, xamarin-android, xamarin-forms, xamarin-ios
- Language: C#
- Homepage:
- Size: 375 KB
- Stars: 1
- Watchers: 3
- Forks: 1
- Open Issues: 0
-
Metadata Files:
- Readme: Readme.md
- License: LICENSE
Awesome Lists containing this project
README
# Creating Interactive Charts in Xamarin.Forms
Displaying data in mobile apps using charts is common, but drawing the chart can be very difficult. It requires a lot of calculations, figuring out distances between each point, then drawing them on the chart.
And to make matters more difficult, we need to use platform-specific iOS and Android APIs in order to draw the charts on the screen and implement touch gestures.
Let's explore how we can leverage [Syncfusion Charts](https://help.syncfusion.com/xamarin/charts/overview) to make our lives easier, requiring less math and allowing us to use cross-platform APIs in [Xamarin.Forms](https://dotnet.microsoft.com/apps/xamarin/xamarin-forms?WT.mc_id=mobile-0000-bramin)!
Here's where you can find completed code samples:
- [CreateInteractiveCharts](https://github.com/brminnick/CreateInteractiveCharts/tree/master/Source), The completed code from this walkthrough
- [GitTrends](https://github.com/brminnick/GitTrends), An iOS and Android app to monitor the Views and Clones happening on your GitHub repositories
| Android | iOS |
| ------ | ----- |
|  |
|  |
|
## Drawing Charts, Before Syncfusion
To draw charts without Syncfusion, we use libraries like [`CoreGraphics.CGContext`](https://docs.microsoft.com/dotnet/api/coregraphics.cgcontext?view=xamarin-ios-sdk-12&WT.mc_id=mobile-0000-bramin) & [`CoreGraphics.CGPoint`](https://docs.microsoft.com/dotnet/api/coregraphics.cgpoint?view=xamarin-ios-sdk-12&WT.mc_id=mobile-0000-bramin) on iOS and [`Android.Graphics.Path`](https://docs.microsoft.com/dotnet/api/android.graphics.path?view=xamarin-android-sdk-9&WT.mc_id=mobile-0000-bramin) & [`Android.Graphics.Paint`](https://docs.microsoft.com/dotnet/api/android.graphics.paint?view=xamarin-android-sdk-9&WT.mc_id=mobile-0000-bramin) on Android. These libraries are platform-specific, meaning we cannot use them in our [Xamarin.Forms](https://dotnet.microsoft.com/apps/xamarin/xamarin-forms?WT.mc_id=mobile-0000-bramin) cross-platform UI.
For example, check out this code from [XWeather](https://github.com/colbylwilliams/XWeather), a weather app built using [Xamarin.iOS](https://docs.microsoft.com/xamarin/ios?WT.mc_id=mobile-0000-bramin) and [Xamarin.Android](https://docs.microsoft.com/xamarin/android?WT.mc_id=mobile-0000-bramin):
### XWeather, iOS Example
_[Link to Source Code](https://github.com/colbylwilliams/XWeather/blob/master/XWeather/iOS/ViewControllers/DailyGraphView.cs)_
```csharp
var graphRect = new CGRect (rect.X + padding, rect.Y + padding, rect.Width - (padding * 2), rect.Height - (padding * 2));
// ...
var scaleHigh = NMath.Round (highest, MidpointRounding.AwayFromZero);
var scaleLow = lowest < 0 ? NMath.Round (lowest, MidpointRounding.AwayFromZero) : NMath.Round (lowest);
// ...
var rangePadding = Settings.UomTemperature.IsImperial () ? scalePadding : (scalePadding / 2);
using var cgContex = UIGraphics.GetCurrentContext();
using var point = new CGPath ();
point.MoveToPoint(graphRect.GetMinX (), graphRect.GetMaxY ());
point.AddLines(new [] {
new CGPoint(graphRect.GetMinX (), graphRect.GetMinY ()),
new CGPoint(graphRect.GetMinX (), graphRect.GetMaxY ()),
new CGPoint(graphRect.GetMaxX (), graphRect.GetMaxY ())
});
cgContex.AddPath(p);
cgContex.DrawPath(CGPathDrawingMode.Stroke);
```
### XWeather, Android Example
_[Link to Source Code](https://github.com/colbylwilliams/XWeather/blob/master/XWeather/Droid/View/DailyGraphView.cs)_
```csharp
var graphRect = new RectF (padding, padding, canvas.Width - padding, canvas.Height - padding);
using var path = new Path();
path.MoveTo(graphRect.Left, graphRect.Top);
path.LineTo(graphRect.Left, graphRect.Bottom);
path.LineTo(graphRect.Right, graphRect.Bottom);
paint.SetStyle(Paint.Style.Stroke);
canvas.DrawPath(path, paint);
```
All this code, and we haven't yet touched on adding touch gestures like pan + zoom, yet.
Let's look at how to do it with Syncfusion instead.
# Drawing Charts With Syncfusion
Syncfusion makes our lives easier by using the [`SfCharts`](https://help.syncfusion.com/xamarin/charts/overview) library. It doesn't require any complex calculations, and, best of all, it is cross-platform and can be used in our [Xamarin.Forms](https://dotnet.microsoft.com/apps/xamarin/xamarin-forms?WT.mc_id=mobile-0000-bramin) project!
Let's look at how to install and implement [`SfCharts`](https://help.syncfusion.com/xamarin/charts/overview).
## 0. Getting Started
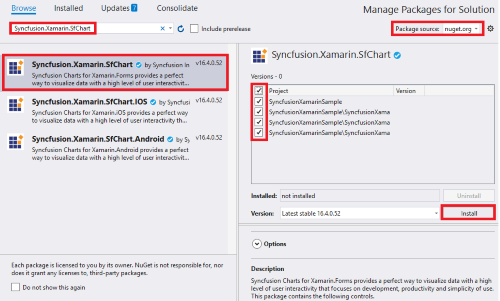
### Install Syncfusion NuGet Packages
- Install [Syncfusion.Xamarin.SfChart NuGet Package](https://www.nuget.org/packages/Syncfusion.Xamarin.SfChart/) into each project, e.g. .NET Standard Project, Xamarin.iOS Project and Xamarin.Android project
### Initialize Syncfusion Charts, iOS
In `AppDelegate.cs`, in the `FinishedLaunching` method, add `Syncfusion.SfChart.XForms.iOS.Renderers.SfChartRenderer.Init();` after `Xamarin.Forms.Forms.Init();`.
Here is an example:
```cs
public class AppDelegate : Xamarin.Forms.Platform.iOS.FormsApplicationDelegate
{
public override bool FinishedLaunching(UIApplication app, NSDictionary options)
{
Xamarin.Forms.Forms.Init();
Syncfusion.SfChart.XForms.iOS.Renderers.SfChartRenderer.Init();
LoadApplication(new App());
return base.FinishedLaunching(app, options);
}
}
```
### Create Data Model for Chart
Let's create a new class called `ChartDataModel` that we'll use as the model to hold the data for our chart:
```csharp
class ChartDataModel
{
public DateTime Date { get; set; }
public int Value { get; set; }
}
```
## 1. Create a Custom Chart
Let's start by creating a new class called `AreaSeriesChart`:
```csharp
class AreaSeriesChart : SfChart
{
public AreaSeriesChart()
{
}
}
```
In this class, let's create a static method to generate data called `IEnumerable GenerateData()`:
```csharp
class AreaSeriesChart : SfChart
{
public AreaSeriesChart()
{
}
static IEnumerable GenerateData(int count, int maxValue)
{
var random = new Random();
for (int i = 0; i < count; i++)
{
yield return new ChartDataModel
{
Date = DateTime.Now.Subtract(TimeSpan.FromDays(i)),
Value = random.Next(maxValue)
};
}
}
}
```
Next, in the constructor of `AreaSeriesChart`, let's create an `AreaSeries` that will display our data:
```csharp
public AreaSeriesChart()
{
const int numberOfDays = 20;
const int maxValue = 100;
var areaSeries = new AreaSeries
{
Opacity = 0.9,
Label = nameof(ChartDataModel),
ItemsSource = GenerateData(numberOfDays, maxValue),
XBindingPath = nameof(ChartDataModel.Date),
YBindingPath = nameof(ChartDataModel.Value)
};
Series = new ChartSeriesCollection { areaSeries };
}
```
Lastly, in the constructor of `AreaSeriesChart`, let's define our `PrimaryAxis` and `SecondaryAxis`:
```csharp
public AreaSeriesChart()
{
const int numberOfDays = 20;
const int maxValue = 100;
var areaSeries = new AreaSeries
{
Opacity = 0.9,
Label = nameof(ChartDataModel),
ItemsSource = GenerateData(numberOfDays, maxValue),
XBindingPath = nameof(ChartDataModel.Date),
YBindingPath = nameof(ChartDataModel.Value)
};
Series = new ChartSeriesCollection { areaSeries };
PrimaryAxis = new DateTimeAxis
{
IntervalType = DateTimeIntervalType.Days,
Interval = 1,
RangePadding = DateTimeRangePadding.Round,
Minimum = DateTime.Now.Subtract(TimeSpan.FromDays(numberOfDays - 1)),
Maximum = DateTime.Now
};
SecondaryAxis = new NumericalAxis
{
Minimum = 0,
Maximum = maxValue
};
}
```
## 2. Display Chart in App
First, we'll create a new class called `SyncfusionChartPage` which will inherit from `Xamarin.Forms.ContentPage` to display our new chart:
```csharp
class SyncfusionChartPage : ContentPage
{
public SyncfusionChartPage()
{
Title = "Syncfusion Area Series Chart";
Padding = new Thickness(0, 10, 0, 0);
Content = new AreaSeriesChart();
}
}
```
And lastly, in `App.cs`, we'll assign `MainPage` to be our newly created `SyncfusionChartPage`:
```csharp
public class App : Application
{
public App()
{
MainPage = new NavigationPage(new SyncfusionChartPage());
}
}
```
Great! Now we have a chart in our app that displays our data:

## 3. Make the Chart Interactive
First, let's add the ability to see the exact value of the data by adding `ChartTrackballBehavior`
```csharp
public AreaSeriesChart()
{
const int numberOfDays = 20;
const int maxValue = 100;
var areaSeries = new AreaSeries
{
Opacity = 0.9,
Label = nameof(ChartDataModel),
ItemsSource = GenerateData(numberOfDays, maxValue),
XBindingPath = nameof(ChartDataModel.Date),
YBindingPath = nameof(ChartDataModel.Value)
};
Series = new ChartSeriesCollection { areaSeries };
PrimaryAxis = new DateTimeAxis
{
IntervalType = DateTimeIntervalType.Days,
Interval = 1,
RangePadding = DateTimeRangePadding.Round,
Minimum = DateTime.Now.Subtract(TimeSpan.FromDays(numberOfDays - 1)),
Maximum = DateTime.Now
};
SecondaryAxis = new NumericalAxis
{
Minimum = 0,
Maximum = maxValue
};
ChartBehaviors = new ChartBehaviorCollection
{
new ChartTrackballBehavior()
};
}
```
Next, let's add the ability to pan and zoom by adding `ChartZoomPanBehavior`:
```csharp
public AreaSeriesChart()
{
const int numberOfDays = 20;
const int maxValue = 100;
var areaSeries = new AreaSeries
{
Opacity = 0.9,
Label = nameof(ChartDataModel),
ItemsSource = GenerateData(numberOfDays, maxValue),
XBindingPath = nameof(ChartDataModel.Date),
YBindingPath = nameof(ChartDataModel.Value)
};
Series = new ChartSeriesCollection { areaSeries };
PrimaryAxis = new DateTimeAxis
{
IntervalType = DateTimeIntervalType.Days,
Interval = 1,
RangePadding = DateTimeRangePadding.Round,
Minimum = DateTime.Now.Subtract(TimeSpan.FromDays(numberOfDays - 1)),
Maximum = DateTime.Now
};
SecondaryAxis = new NumericalAxis
{
Minimum = 0,
Maximum = maxValue
};
ChartBehaviors = new ChartBehaviorCollection
{
new ChartZoomPanBehavior(),
new ChartTrackballBehavior()
};
}
```
And now we have an interactive chart!
