https://github.com/thiagodnf/bubble-chart-for-gnuplot
This tool generates a bubble chart script for Gnuplot
https://github.com/thiagodnf/bubble-chart-for-gnuplot
bubble-chart chart gnuplot
Last synced: 10 months ago
JSON representation
This tool generates a bubble chart script for Gnuplot
- Host: GitHub
- URL: https://github.com/thiagodnf/bubble-chart-for-gnuplot
- Owner: thiagodnf
- License: mit
- Created: 2016-06-22T13:57:50.000Z (about 10 years ago)
- Default Branch: master
- Last Pushed: 2023-10-06T23:40:37.000Z (almost 3 years ago)
- Last Synced: 2024-04-09T21:14:28.929Z (over 2 years ago)
- Topics: bubble-chart, chart, gnuplot
- Language: JavaScript
- Homepage: https://bubble-chart-for-gnuplot.vercel.app
- Size: 1.2 MB
- Stars: 4
- Watchers: 3
- Forks: 4
- Open Issues: 2
-
Metadata Files:
- Readme: README.md
- License: LICENSE
Awesome Lists containing this project
README

Generate gnuplot scripts for bubble charts
[](https://github.com/thiagodnf/bubble-chart-for-gnuplot/releases/latest)
[](https://github.com/thiagodnf/bubble-chart-for-gnuplot/graphs/contributors)
[](https://github.com/almende/thiagodnf/bubble-chart-for-gnuplot)
[](https://opensource.org/licenses/mit-license.php)
[](https://github.com/ellerbrock/open-source-badges/)
## Usage
Just open https://bubble-chart-for-gnuplot.vercel.app
## Screenshots

## Usage
You need to enter labels separated by ";". Further quadrants, use the "example" option on app. Generate the script and run following command on terminal:
```sh
$ gnuplot script.gnu
```
Next, you can see some examples of generated results.
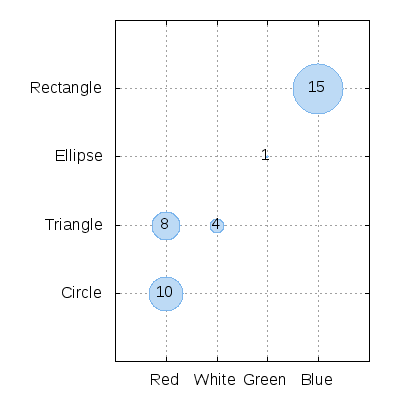
#### One Quadrant
The following code generates a chart with one quadrant:
```text
Red;Circle;10
White;Triangle;4
Red;Triangle;8
Green;Ellipse;1
Blue;Rectangle;15
```
The result is:
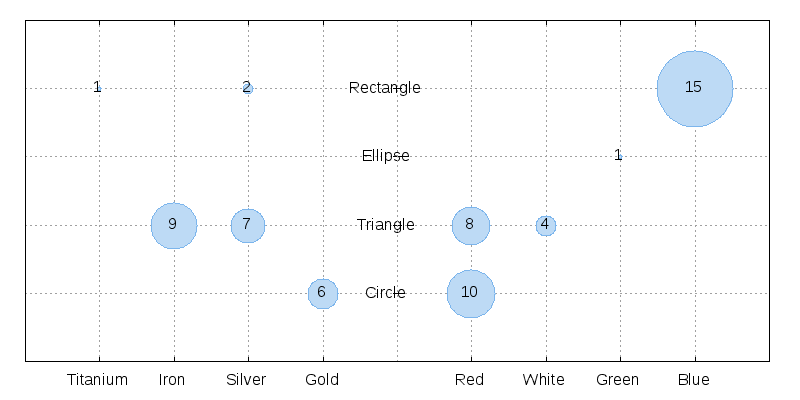
#### Two Quadrants
Separate the quadrant by using the "#" character. The following code generates a chart with two quadrants:
```text
Red;Circle;10
White;Triangle;4
Red;Triangle;8
Green;Ellipse;1
Blue;Rectangle;15
#
Gold;Circle;6
Silver;Rectangle;2
Silver;Triangle;7
Iron;Triangle;9
Titanium;Rectangle;1
```
The result is:
#### Four Quadrants
Separate the quadrant by using the "#" character. The following code generates a chart with two quadrant:
```
Red;Circle;10
White;Triangle;4
Red;Triangle;8
Green;Ellipse;1
Blue;Rectangle;15
#
Gold;Circle;6
Silver;Rectangle;2
Silver;Triangle;7
Iron;Triangle;9
Titanium;Rectangle;1
#
Red;Circle;10
White;Triangle;4
Red;Triangle;8
Green;Ellipse;1
Blue;Rectangle;15
#
Gold;Circle;6
Silver;Rectangle;2
Silver;Triangle;7
Iron;Triangle;9
Titanium;Rectangle;1
```
The result is:

## For Developers
To run this project, run the following command:
```sh
npm run dev
```
If you want to commit some changes, run the following command:
```sh
npm run lint-fix
```
## Q&A
* How can I increase the circle size?
* Use the SCALE option to increase or decrease the circle size.
## Questions or Suggestions
Feel free to create issues here as you need
## Contribute
Contributions to the this project are very welcome! We can't do this alone! Feel free to fork this project, work on it and then make a pull request.
## Authors
* **Thiago Ferreira** - *Initial work*
See also the list of [contributors](https://github.com/thiagodnf/bubble-chart-for-gnuplot/graphs/contributors) who participated in this project.
## License
This project is licensed under the MIT License - see the [LICENSE](LICENSE) file for details
## Donate
I open-source almost everything I can, and I try to reply to everyone needing help using these projects. Obviously, this takes time. You can integrate and use these projects in your applications for free! You can even change the source code and redistribute (even resell it).
However, if you get some profit from this or just want to encourage me to continue creating stuff, there are few ways you can do it:

Thanks! ❤️