https://github.com/tianzhuqiao/bsmplot
A cross-platform tool to visualize time series.
https://github.com/tianzhuqiao/bsmplot
chart csv mat plot time-series ulog vcd wxpython
Last synced: 10 months ago
JSON representation
A cross-platform tool to visualize time series.
- Host: GitHub
- URL: https://github.com/tianzhuqiao/bsmplot
- Owner: tianzhuqiao
- License: mit
- Created: 2024-02-11T17:34:52.000Z (over 2 years ago)
- Default Branch: main
- Last Pushed: 2025-04-04T23:32:18.000Z (over 1 year ago)
- Last Synced: 2025-05-11T11:48:28.919Z (about 1 year ago)
- Topics: chart, csv, mat, plot, time-series, ulog, vcd, wxpython
- Language: Python
- Homepage:
- Size: 7.9 MB
- Stars: 2
- Watchers: 2
- Forks: 0
- Open Issues: 0
-
Metadata Files:
- Readme: README.md
- License: LICENSE
Awesome Lists containing this project
README
# bsmplot
**bsmplot** is a cross-platform tool to visualize time series based on [Matplotlib](https://matplotlib.org/) and [wxPython](https://wxpython.org/).
## Installation
```
$ pip install bsmplot
```
To start from terminal
```
$ bsmplot
```
Add shortcut to desktop / Start Menu
```
$ bsmplot --init
```
## Supported data source
- VCD (value change dump)
- PX4 [ulog](https://docs.px4.io/main/en/dev_log/ulog_file_format.html)
- CSV
- Matlab (.mat)
- [HDF5](https://docs.h5py.org/en/stable/)
- [netCDF](https://unidata.github.io/netcdf4-python/)
- [ZMQ](https://zeromq.org/) subscriber. **json** format is supported by defaut. If corresponding package is installed, the following format is also supported
- [bson](https://github.com/py-bson/bson)
- [cbor](https://github.com/agronholm/cbor2)
- [msgpack](https://msgpack.org/)
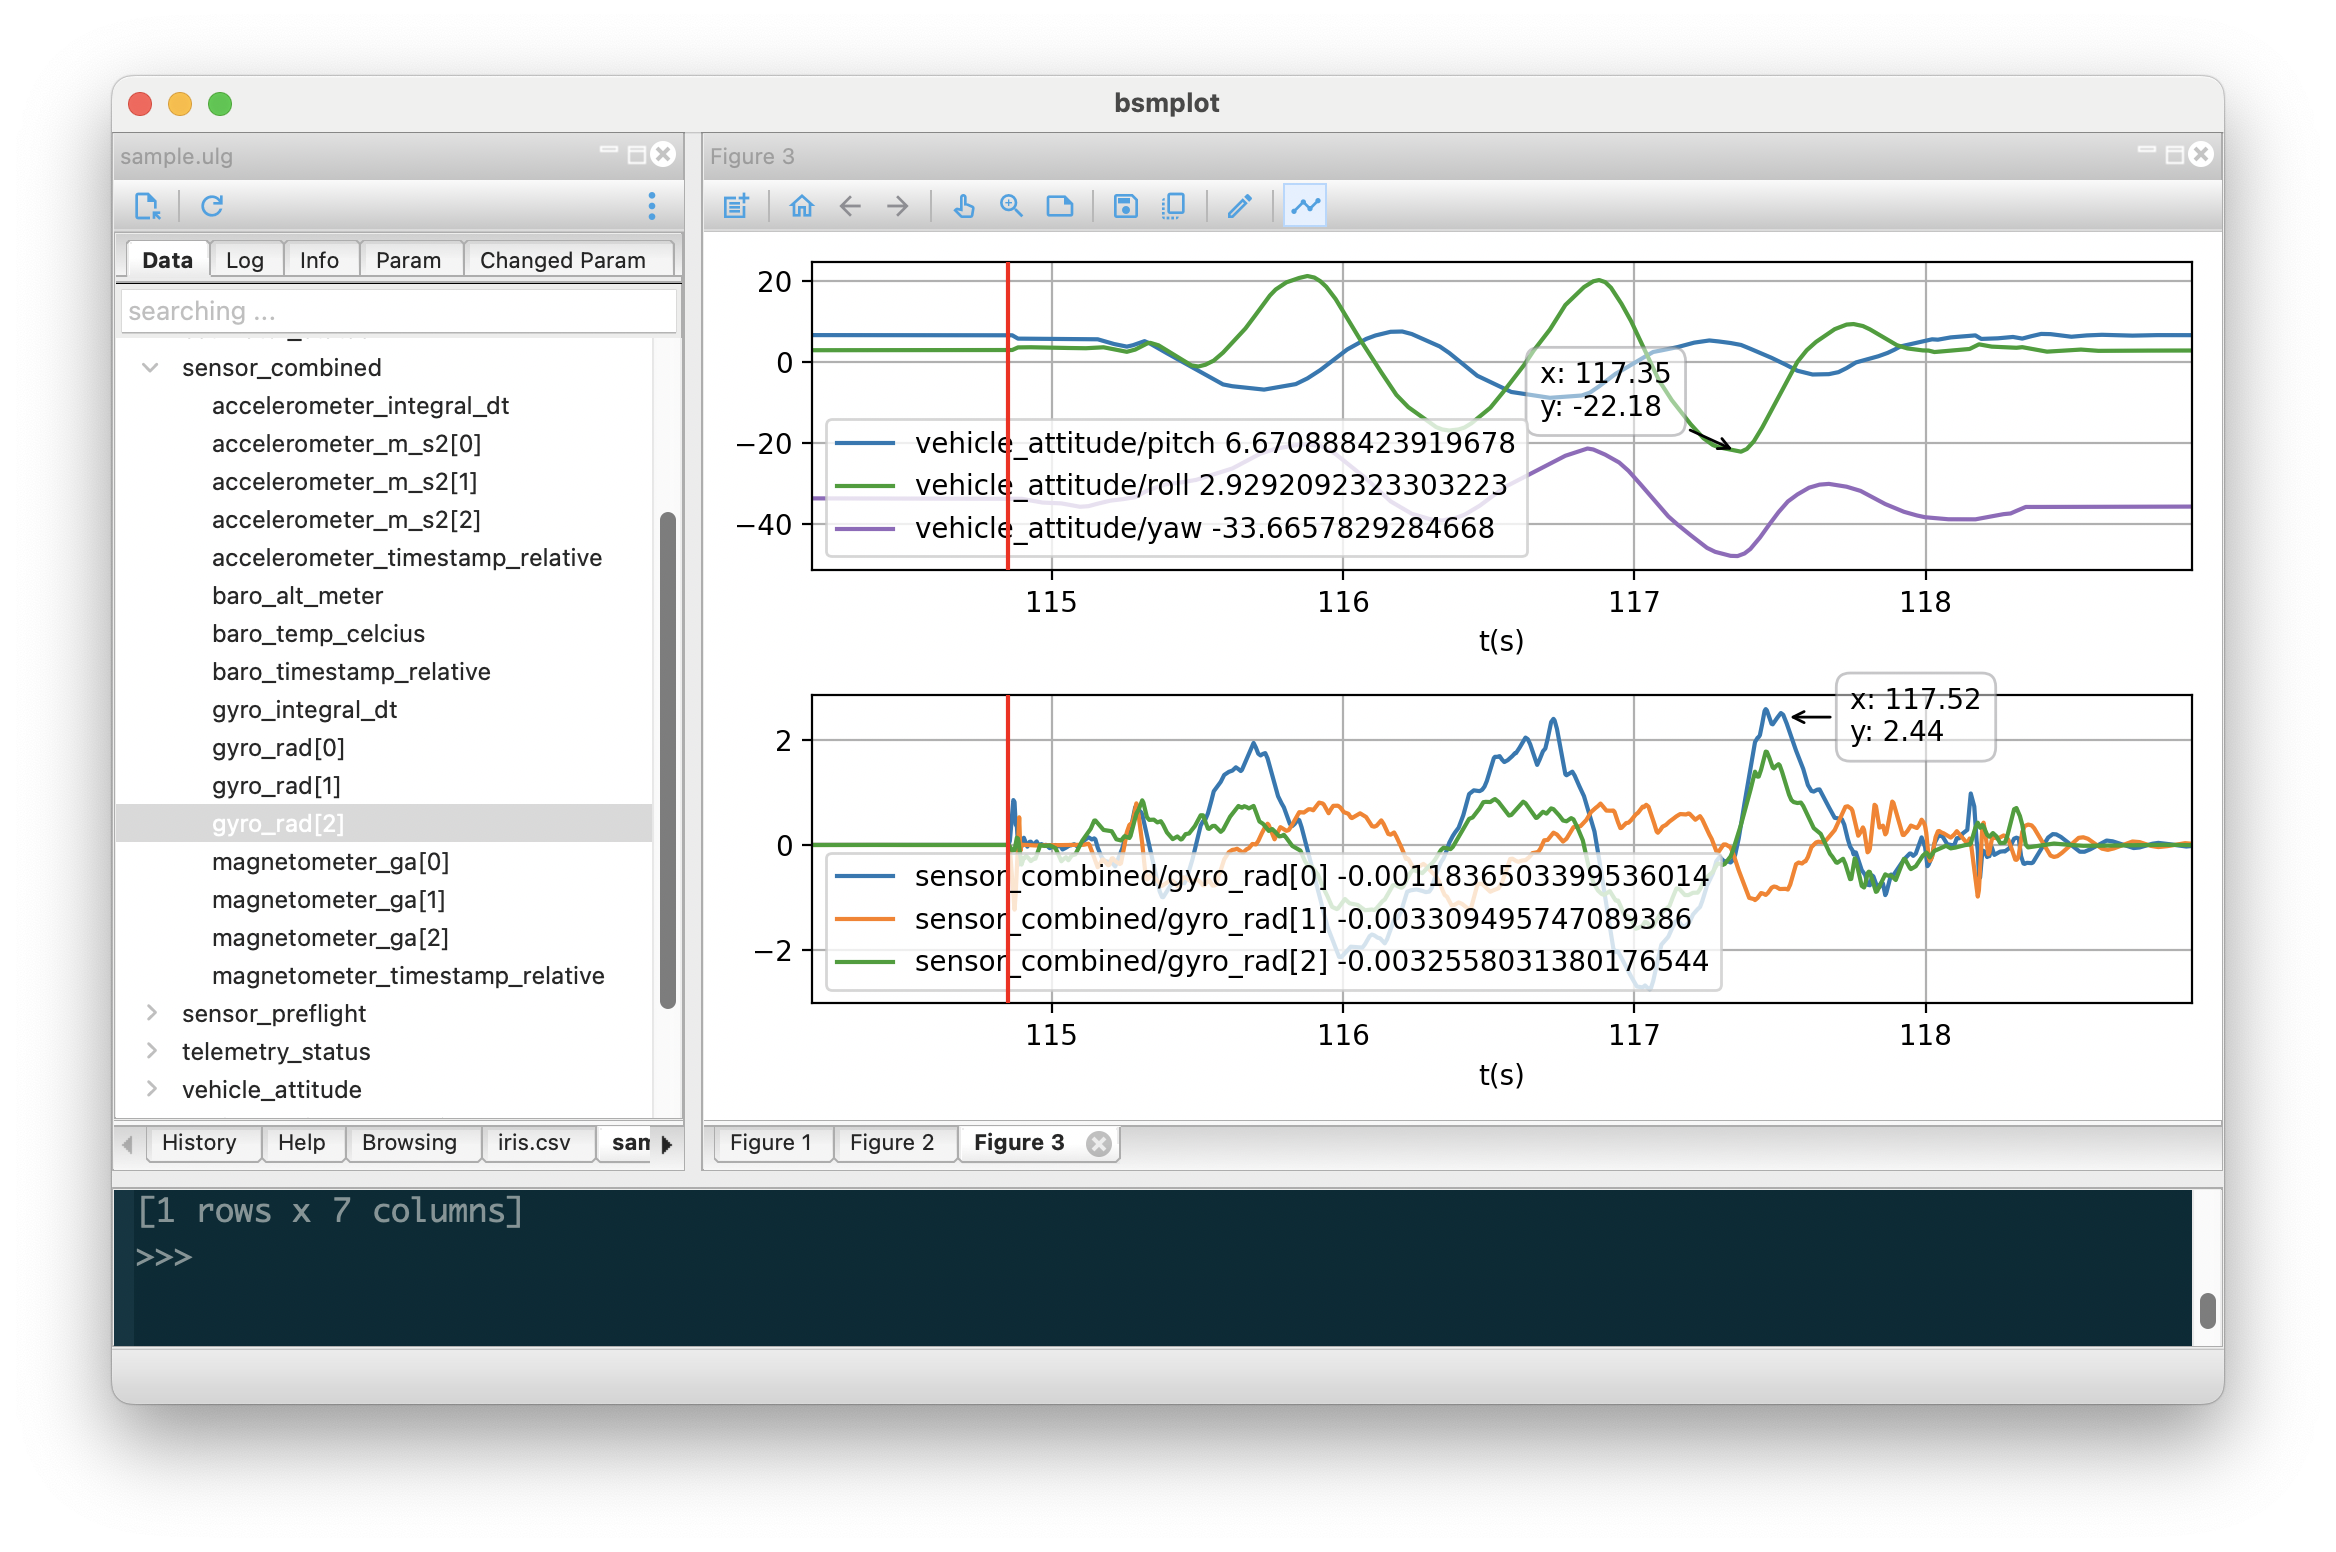
## Plot the data
To plot the data, simply double click a signal. It will plot the signal on the current figure window (or create one if there is no figure window then plot).

You can also drag the signal to the figure window.
If the data has timestamp field (e.g., ulog), it will be used as x-axis data; otherwise (e.g., csv), the x-axis will be the index by default. And you can also set some signal as x-axis data, which will be shown in **bold**.

Many operations of the figure can be done via the context menu (right click), and the toolbar on top. For example, to create a subplot with shared x-axis,

If the signal has 2d/3d data, it will be shown in [glsurface](https://github.com/tianzhuqiao/glsurface) window. For 3d data, the 1st dimension will be treated as time axis.

## Process the data
To process the data, right click the signal, and select the function to run. Following functions are pre-defined
1. Quaternion to Yaw/Pitch/Roll
2. Radian to degree
3. Degree to Radian
4. Moving average

If you are familiar with python code, you can add your own functions. You basically need to define the **inputs**, **equation**, and **outputs**. The number of **outputs** must match the actual ones returned from the **equation**.

If the processing is too complicated, you can also export the data to shell: right click -> Export to shell (or Export to shell with timestamp if available)

Then in the shell, you can access the exported data, and run any python command.
