https://github.com/timeu/gwasviewer
Composite of Dygrap for GWAS and GeneViewer for Genes
https://github.com/timeu/gwasviewer
Last synced: about 1 year ago
JSON representation
Composite of Dygrap for GWAS and GeneViewer for Genes
- Host: GitHub
- URL: https://github.com/timeu/gwasviewer
- Owner: timeu
- License: mit
- Created: 2011-02-14T11:44:58.000Z (over 15 years ago)
- Default Branch: master
- Last Pushed: 2020-10-13T09:53:17.000Z (almost 6 years ago)
- Last Synced: 2024-12-26T13:26:09.492Z (over 1 year ago)
- Language: Java
- Homepage:
- Size: 12.8 MB
- Stars: 2
- Watchers: 2
- Forks: 0
- Open Issues: 1
-
Metadata Files:
- Readme: README.md
- Changelog: CHANGELOG
- License: LICENSE
Awesome Lists containing this project
README
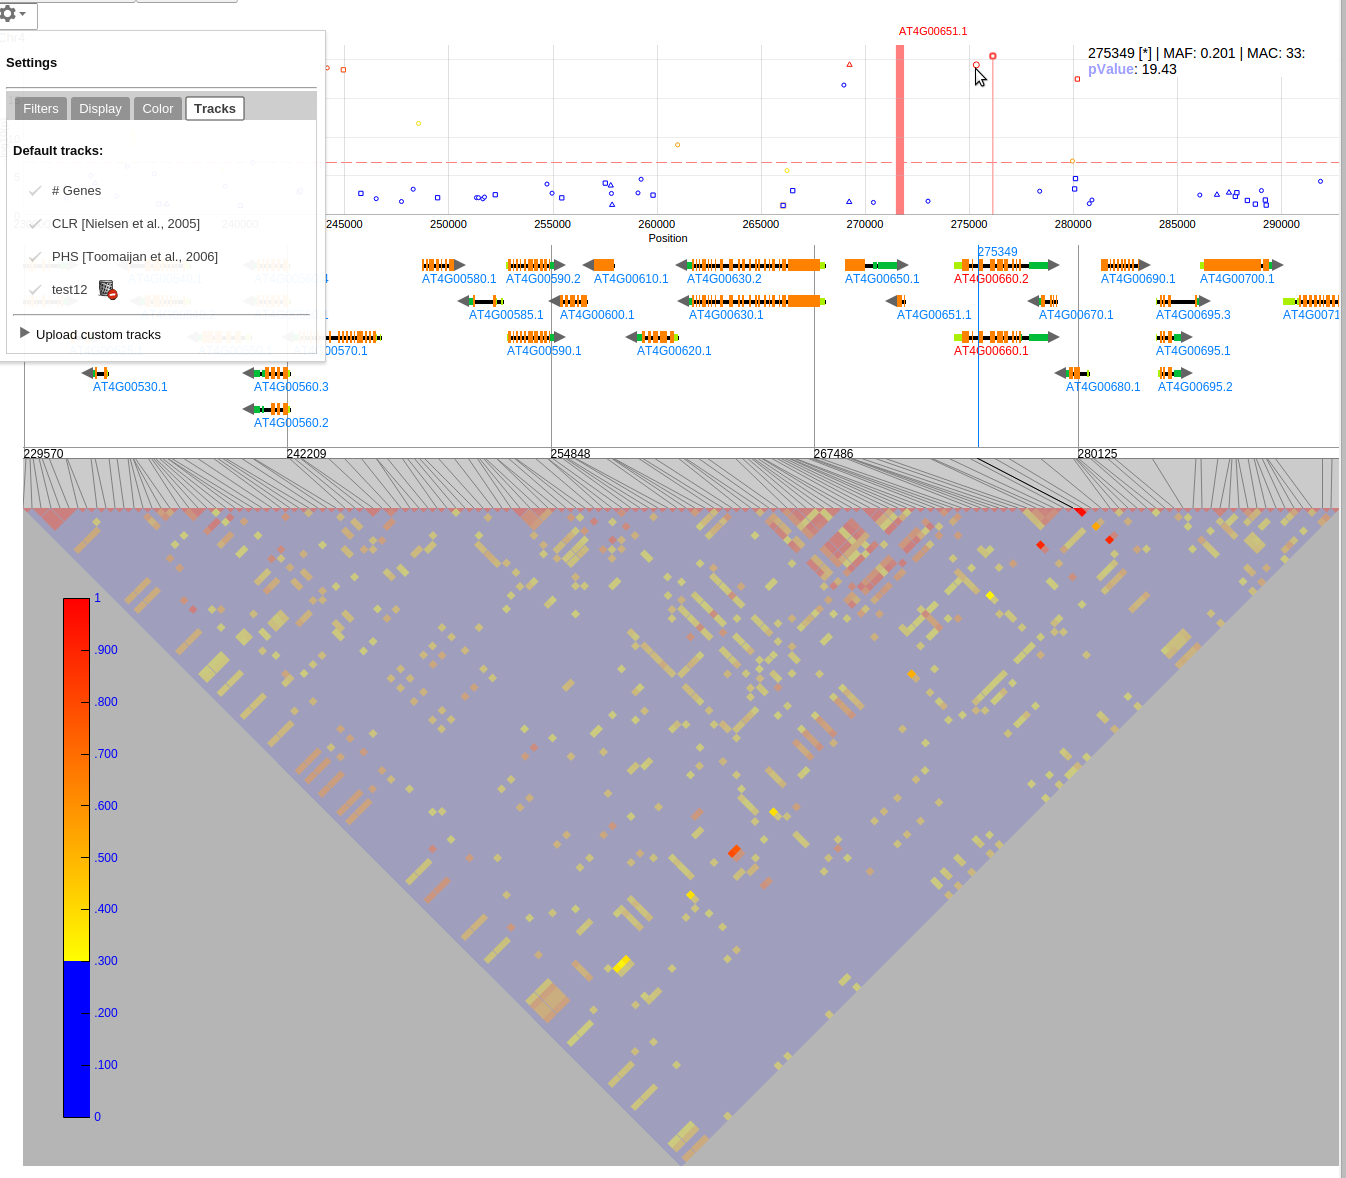
## What is GWASViewer?
GWASViewer is a Google Web Toolkit (GWT) widget for displaying interactive Manhattan plots.
It is a composite of multiple different GWT widgets:
- [dygraphs-gwt][0] as the actual Manhattan plot and statistic plots
- [GeneViewer][1] as the gene annotation track
- [LDViewer][2] as a LD triangle viewer
## How do I use it?
Following minimum steps are required:
```JAVA
// create a GeneDataSource for the `GeneViewer` to dynamically fetch genes
final GeneDataSource geneDataSource = new GeneDataSource() {
@Override
public void fetchGenes(String chr, int start, int end, boolean getFeatures, FetchGenesCallback callback) {
// fetch the genes for the provided region from the backend for example
}
@Override
public void fetchGeneInfo(String name, FetchGeneInfoCallback callback) {
// fetch the gene info/description for the specific gene name
}
};
// the default color of the Manhattan plot is blue and the marked regions are green
GWASViewer viewer = new GWASViewer("Chr1",new String[]{"blue"},"green",geneDataSource);
// draw the manhattan plot
viewer.draw(dataTable, maxScore, fdrThreshold, chrLengths);
```
### Load list of tracks and handle the track selection
`GWASViewer` can display a list of tracks when the user opens the settings popup.
The user can set this list by using the `setTracks` function:
```JAVA
Tracks[] listOfTracks = // get from server for example
viewer.setTracks(listOfTracks);
```
When the user selects a track from the popup, an `SelectTrackEvent` event will be fired. The user can handle the event
retrieve the data from the backend and then call `setTrackData` to display the track:
```JAVA
viewer.addHandler(new SelectTrackEvent.Handler() {
@Override
public void onSelectTrack(SelectTrackEvent event) {
DataTable dataTable = //get track data from backend for example
viewer.setTrackData(event.getId(),event.isStacked(),dataTable);
}
},SelectTrackEvent.getType());
```
The track data has to be provided as a [gwt-charts][3] DataTable object with 2 columns (position, and value).
### Display LD Triangle plot or LD colored values
To display the LD triangle plot use the `loadLDPlot` function and for coloring the Manhattan plots based on LD
the user can use `showColoredLDValues`. For more information refer to the [LDViewer documentation][2].
### Highlight region and select SNPs
To highlight one or multiple regions, use the `addDisplayFeature` function and to clear it use `clearDisplayFeatures()`:
```JAVA
viewer.addDisplayFeature(new DisplayFeature("AT4G00651.1", 271486, 271879, "red"), true);
viewer.addDisplayFeature(new DisplayFeature("Some interesting region", 8753993, 9241760, "green"), true);
```
To select one or more SNPs use `setSelections` and to clear `clearSelections()`:
```JAVA
selections.add(148);
selections.add(1220);
selections.add(2240);
// false will redraw after SNPs are select. If it is set to true, use viewer.refresh() to update the plot
viewer.setSelections(selections,false);
```
### Uploading tracks and custom TrackUploadWidget
By default the `DefaultTrackUploadWidget` is displayed. It supports uploading to a backend or to the local storage.
The upload url can be changed with `setDefaultTrackUploadUrl`. The file has to be a comma separated file that can be either
provided by URL or by selecting it with the a file input.
When the user uploads a track the `UploadTrackEvent` is fired.
To implement a custom upload widget, create a `Composite` that implements the `UploadTrackWidget` marker interface
and use the `setUploadTrackWidget`. To disable the upload functionality call the function with `null`.
## Useful events:
See the sample app below for an example how to use those events
| Event | When fired ? | Parameters | Component |
|------ | ------------- |-----------| ------------|
| ClickGeneEvent | When the user clicks on a gene in the gene annotation track | `Gene` instance | `GeneViewer`|
| HighlightGeneEvent | When the user moves the mouse over a gene in the gene annotation track | `Gene` instance | `GeneViewer` |
| UnhighlightGeneEvent | When the user moved out of a gene in the gene annotation track | - | `GeneViewer` |
| ZoomChangeEvent | When the user changes the zoom level of the Manhattan plot | start and end | `GWASViewer` |
| HighlightPointEvent | When the user highlights a point in the Manhattan plot | x, Point[], row, seriesName | `GWASViewer` |
| ClickPointEvent | When the user clicks on a point in the Manhattan plot | x, Point[] | `GWASViewer` |
| SelectTrackEvent | When the user selects a track from the settings popup | id | `GWASViewer` |
| UploadTrackEvent | When the user uploads a custom track | - | `GWASViewer` |
| DeleteTrackEvent | When the user deletes a custom track | id | `GWASViewer` |
## How do I install it?
If you're using Maven, you can add the following to your ``
section:
```xml
com.github.timeu.gwtlibs.gwasviewer
gwasviewer
1.0.0
```
GeneViewer uses [GWT 2.8's][4] new [JSInterop feature][5] and thus it has to be enabled in the GWT compiler args.
For maven:
```xml
-generateJsInteropExports
```
or passing it to the compiler via `-generateJsInteropExports`
You can also download the [jar][6] directly or check out the source using git
from and build it yourself. Once
you've installed LDViewer, be sure to inherit the module in your .gwt.xml
file like this:
```xml
```
## Where can I learn more?
* Check out the [sample app][7] ([Source Code][8]) for a full example of using GeneViewer.
[0]: http://gitub.com/timeu/dygraphs-gwt
[1]: http://github.com/timeu/GeneViewer
[2]: http://github.com/timeu/LDViewer
[3]: https://github.com/google/gwt-charts
[4]: http://www.gwtproject.org/release-notes.html#Release_Notes_2_8_0_BETA1
[5]: https://docs.google.com/document/d/10fmlEYIHcyead_4R1S5wKGs1t2I7Fnp_PaNaa7XTEk0/edit#heading=h.o7amqk9edhb9
[6]: https://github.com/timeu/GWASViewer/releases
[7]: http://timeu.github.io/GWASViewer
[8]: https://github.com/timeu/GWASViewer/tree/master/gwasviewer-sample