https://github.com/timkpaine/ipydagred3
ipywidgets library for drawing directed acyclic graphs in jupyterlab using dagre-d3
https://github.com/timkpaine/ipydagred3
d3 dagre dagre-d3 graph graphviz ipywidget ipywidgets jupyter jupyterlab jupyterlab-extension python
Last synced: 8 months ago
JSON representation
ipywidgets library for drawing directed acyclic graphs in jupyterlab using dagre-d3
- Host: GitHub
- URL: https://github.com/timkpaine/ipydagred3
- Owner: timkpaine
- License: apache-2.0
- Created: 2020-02-29T23:01:15.000Z (almost 6 years ago)
- Default Branch: main
- Last Pushed: 2024-08-30T19:59:30.000Z (over 1 year ago)
- Last Synced: 2024-10-17T22:10:51.231Z (about 1 year ago)
- Topics: d3, dagre, dagre-d3, graph, graphviz, ipywidget, ipywidgets, jupyter, jupyterlab, jupyterlab-extension, python
- Language: Python
- Homepage:
- Size: 3.69 MB
- Stars: 77
- Watchers: 5
- Forks: 7
- Open Issues: 5
-
Metadata Files:
- Readme: README.md
- Contributing: CONTRIBUTING.md
- License: LICENSE
- Code of conduct: .github/CODE_OF_CONDUCT.md
Awesome Lists containing this project
- awesome-jupyter - ipydagred3 - [ipywidgets](https://github.com/jupyter-widgets/ipywidgets) library for drawing directed acyclic graphs in jupyterlab using dagre-d3. <!--lint enable double-link--> (Visualization)
- awesome-jupyter-resources - GitHub - 15% open · ⏱️ 21.07.2022): (交互式小部件和可视化)
- best-of-jupyter - GitHub - 20% open · ⏱️ 27.10.2025): (Interactive Widgets & Visualization)
README
# ipydagred3
ipywidgets library for drawing directed acyclic graphs in jupyterlab using [dagre-d3](https://github.com/tbo47/dagre-es)
[](https://github.com/timkpaine/ipydagred3/actions?query=workflow%3A%22Build+Status%22)
[](https://codecov.io/gh/timkpaine/ipydagred3)
[](https://pypi.python.org/pypi/ipydagred3)
[](https://pypi.python.org/pypi/ipydagred3)
[](https://www.npmjs.com/package/ipydagred3)
[](https://mybinder.org/v2/gh/timkpaine/ipydagred3/main?urlpath=lab)

## Installation
You can install using `pip`:
```bash
pip install ipydagred3
```
## Features
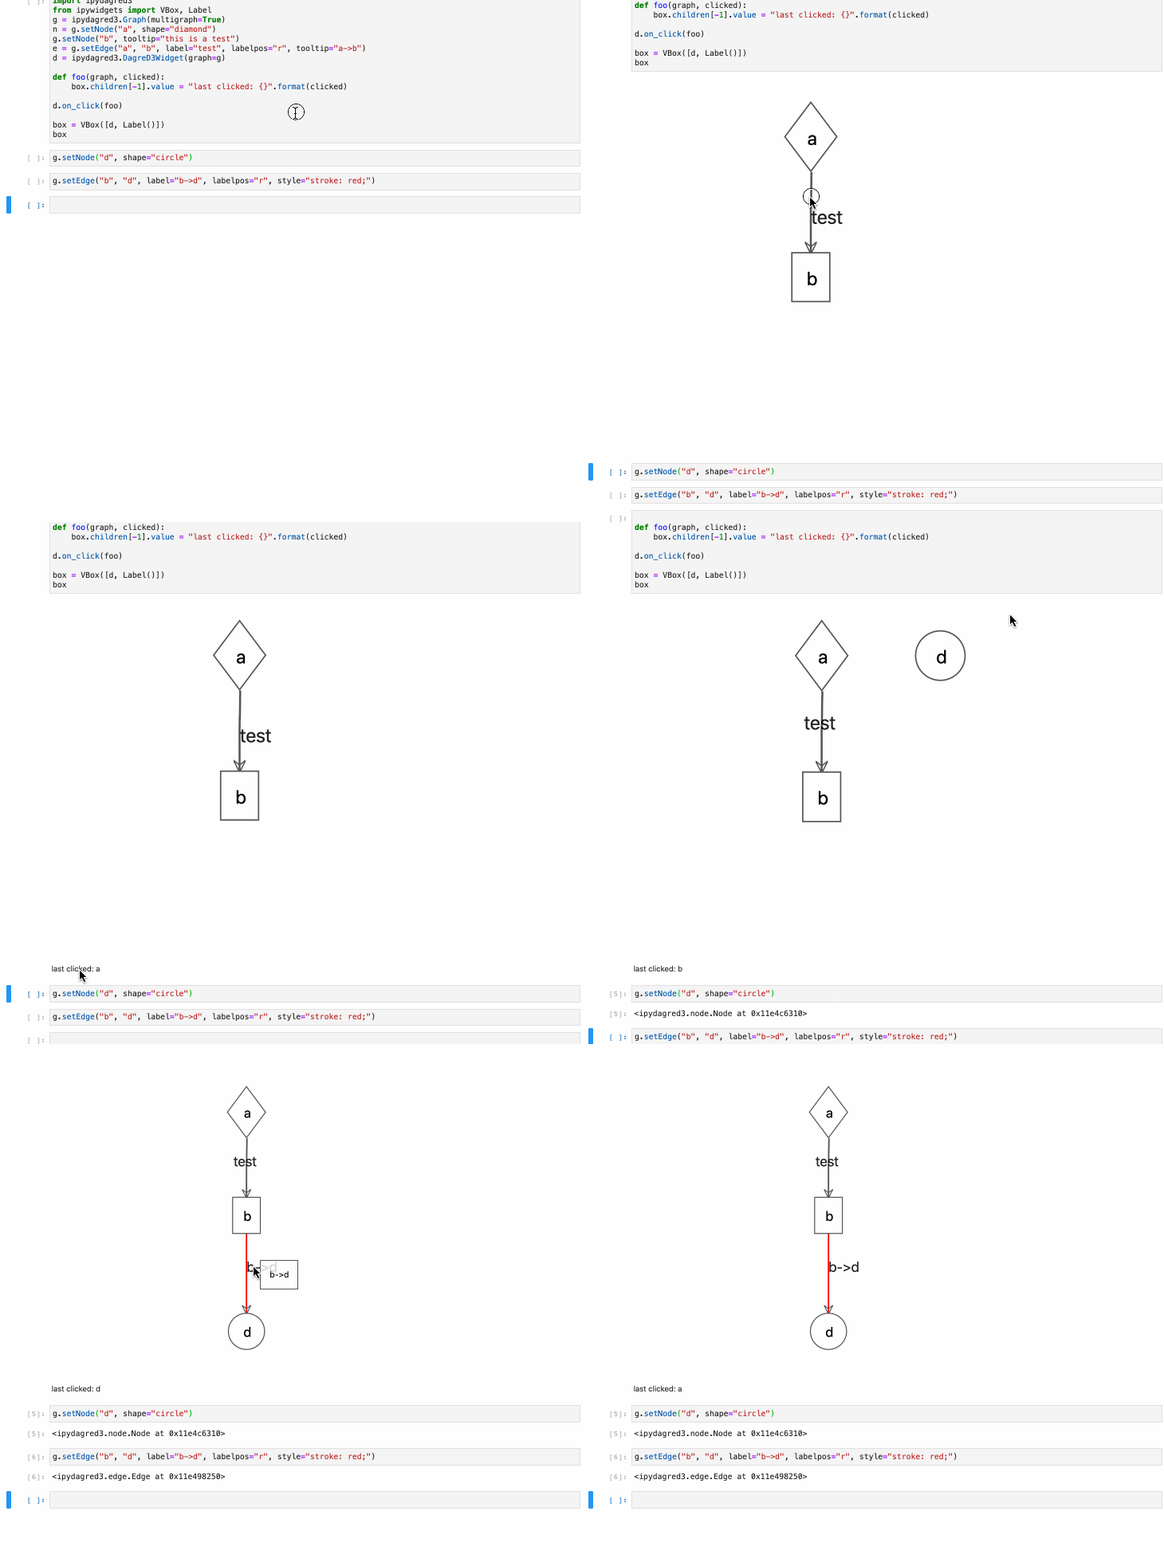
- Dynamically create and modify graphs from python
- Change color, shape, tooltip, etc
- Click events (click on node or edge and get event in ipywidget indicating source, good for node inspector tools)
### Tooltips and Click events

## Examples
Network example from the first gif
[Network Example](https://github.com/timkpaine/ipydagred3/tree/main/docs/examples/example.ipynb)
Tooltip Example from the second gif
[Tooltip Example](https://github.com/timkpaine/ipydagred3/tree/main/docs/examples/tooltip.ipynb)