https://github.com/timmaurice/lovelace-background-graph-entities
The background-graph-entities lovelace component for Home Assistant displays a list of entities with their current state and a mini graph showing the entity's history.
https://github.com/timmaurice/lovelace-background-graph-entities
custom-card entity graph home-assistant lovelace lovelace-card
Last synced: about 1 month ago
JSON representation
The background-graph-entities lovelace component for Home Assistant displays a list of entities with their current state and a mini graph showing the entity's history.
- Host: GitHub
- URL: https://github.com/timmaurice/lovelace-background-graph-entities
- Owner: timmaurice
- License: mit
- Created: 2024-05-17T07:00:44.000Z (almost 2 years ago)
- Default Branch: main
- Last Pushed: 2025-11-10T20:15:02.000Z (5 months ago)
- Last Synced: 2025-11-10T22:11:17.922Z (5 months ago)
- Topics: custom-card, entity, graph, home-assistant, lovelace, lovelace-card
- Language: TypeScript
- Homepage:
- Size: 604 KB
- Stars: 27
- Watchers: 1
- Forks: 0
- Open Issues: 0
-
Metadata Files:
- Readme: README.md
- License: LICENSE
Awesome Lists containing this project
README
# Background Graph Entities Custom Component
[](https://github.com/hacs/integration)

[](https://github.com/timmaurice/lovelace-background-graph-entities/releases)
[](https://github.com/timmaurice/lovelace-background-graph-entities/commits/master)
[](https://github.com/timmaurice/lovelace-background-graph-entities)

## Overview
The `background-graph-entities` custom component for Home Assistant displays a list of entities with their current state and a mini graph showing the entity's history. This component is ideal for monitoring various sensor data, such as temperature, humidity, or other metrics.
## Features
- **Dynamic Background Graphs:** Each entity row features a beautiful, live-updating graph of its history as a background, with smooth, rounded lines.
- **Highly Customizable:**
- **Global & Per-Entity Styling:** Configure graph appearance globally or override settings for each entity individually.
- **Dynamic Line Colors:** Use a single color or define value-based thresholds to create stunning color gradients.
- **Adjustable Graph Appearance:** Control line width, opacity, and an optional glow effect to match your dashboard's theme.
- **Multiple Curve Styles:** Choose between `spline` (default), `linear`, `natural`, or `step` curves to customize the graph's appearance.
- **Powerful UI Editor:** A user-friendly editor makes configuration a breeze.
- **Drag & Drop:** Easily reorder entities and color thresholds.
- **Live Previews:** See your changes instantly.
- **Color Pickers:** Choose colors with ease.
- **Interactive Editing:** Dots appear on the graph only in edit mode, helping you visualize the data points without cluttering the normal view.
- **Performance-Tuned:**
- **Data Downsampling:** Configure `points_per_hour` to show smooth graphs over long periods without slowing down your browser.
- **Configurable Update Interval:** Control how often data is fetched.
- **User-Friendly:**
- **Clickable Entities:** Tap any entity to open its "More Info" dialog.
- **Smart Formatting:** Automatically formats time-based sensors (e.g., travel time) into a human-readable format.
- **Interactive Toggles:** Entities that can be turned on or off (like switches and lights) will display an interactive toggle.
- **Tile Style:** A compact mode that replaces the toggle with an interactive, state-aware icon and provides a cleaner layout.
- **Separate Graph Data:** Optionally display one entity (like a switch) while graphing the history of another (like its power consumption sensor).
- **Secondary State Display:** When using a separate `graph_entity`, you can optionally display its current state next to the main entity's state.
## Localization
The editor is available in the following languages:
- English
- German
- French
Contributing Translations
If you would like to contribute a new translation:
1. Fork the repository on GitHub.
2. Copy the `src/translation/en.json` file and rename it to your language code (e.g., `es.json` for Spanish).
3. Translate all the values in the new file.
4. Submit a pull request with your changes.
## Installation
1. Ensure you have HACS installed.
2. Add this repository to HACS as a custom repository.
```yaml
Repository: https://github.com/timmaurice/lovelace-background-graph-entities
Type: Dashboard
```
3. Install `background-graph-entities` via HACS.
[](https://my.home-assistant.io/redirect/hacs_repository/?owner=timmaurice&repository=lovelace-background-graph-entities&category=Dashboard)
## Configuration
This card can be configured via the UI editor or by using YAML.
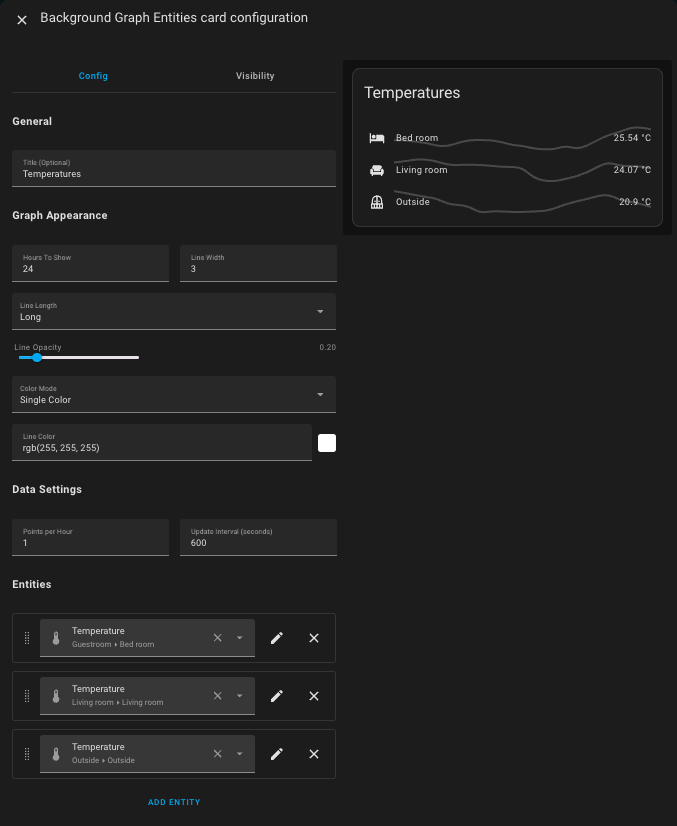
### UI Editor
The card is fully configurable through the UI editor.
1. Add a new card to your dashboard.
2. Search for "Background Graph Entities" and select it.
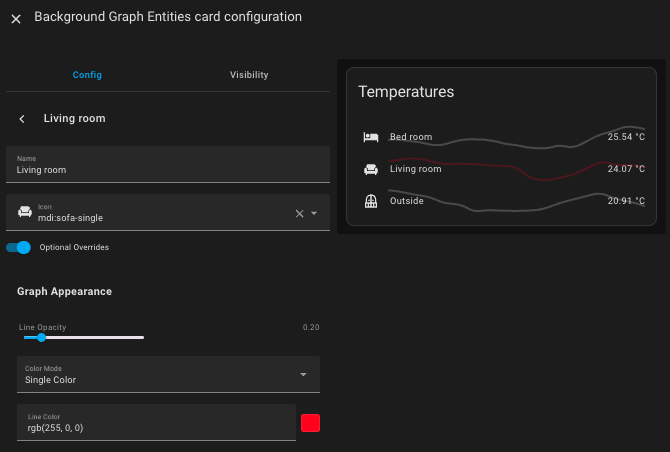
3. Use the editor to configure the card title, entities, and global graph appearance.
4. To customize an individual entity, click the "Edit" icon next to it in the entity list.
### YAML Configuration
#### Card Options
| Name | Type | Default | Description |
| ------------------ | ------- | ------------ | ------------------------------------------------------------------------------------------------------------------------------------------------------------------------------------------------------------------------------------- |
| `type` | string | **Required** | `custom:background-graph-entities` |
| `tile_style` | boolean | `false` | Enables a more compact, tile-like layout. The entity value is placed below the name, and toggles are replaced by an interactive icon. |
| `title` | string | `''` | The title of the card. |
| `hours_to_show` | number | `24` | The number of hours of history to display in the graphs. |
| `line_width` | number | `3` | The width of the graph line in pixels. |
| `line_opacity` | number | `0.2` | The opacity of the graph line. The UI slider allows values from 0.05 (mostly transparent) to 0.8 (more opaque). |
| `line_color` | string | Theme-aware | The color of the graph line. Can be any valid CSS color. Defaults to `white` in dark mode and `black` in light mode. Ignored if `color_thresholds` is used. |
| `line_length` | string | `long` | The length of the graph. Can be `long` or `short`. `short` provides more space for the entity value. |
| `line_glow` | boolean | `false` | Adds a subtle glow effect to the graph line. |
| `curve` | string | `spline` | The interpolation type for the graph line. Can be `spline`, `linear`, `natural`, or `step`. |
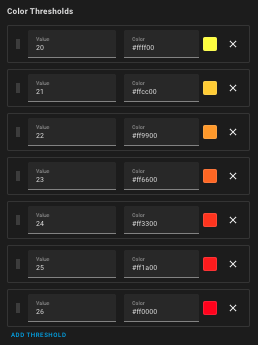
| `color_thresholds` | list | `[]` | A list of color thresholds to create a gradient line. See Advanced Example. |
| `graph_min` | number | `undefined` | Sets a fixed lower bound for the Y-axis of the graph. |
| `graph_max` | number | `undefined` | Sets a fixed upper bound for the Y-axis of the graph. |
| `points_per_hour` | number | `1` | The number of time buckets per hour. The card calculates the median value for each bucket and fills in any gaps with the last known value to create a continuous graph. Higher values provide more detail but may impact performance. |
| `update_interval` | number | `600` | How often to fetch history data, in seconds (e.g., 600 = 10 minutes). |
| `show_icon` | boolean | `true` | Set to `false` to hide the entity icon. |
#### Entity Options
Each entry in the `entities` list can be a string (the entity ID) or an object with more specific configurations.
| Name | Type | Default | Description |
| ---------------------------- | ------- | ------------------------- | --------------------------------------------------------------------------------------------------------- |
| `entity` | string | **Required** | The ID of the entity to display. |
| `name` | string | Entity's friendly name | A custom name for the entity. |
| `icon` | string | Entity's icon | A custom icon for the entity (e.g., `mdi:thermometer`). |
| `icon_color` | string | Theme-aware | A custom color for the icon (e.g., `orange` or `#ffaa00`). Defaults to the theme's icon color. |
| `graph_entity` | string | `entity` ID | An optional entity ID to use for the graph's history data, instead of the main entity. |
| `show_graph_entity_state` | boolean | `false` | If `graph_entity` is set, set this to `true` to display its state next to the main entity's state. |
| `overwrite_graph_appearance` | boolean | `false` | Set to `true` to enable entity-specific graph settings below. Required for per-entity overrides to apply. |
| `line_color` | string | Global `line_color` | Overrides the global `line_color` for this entity only. |
| `line_opacity` | number | Global `line_opacity` | Overrides the global `line_opacity` for this entity only. |
| `color_thresholds` | list | Global `color_thresholds` | Overrides the global `color_thresholds` for this entity only. |
| `graph_min` | number | Global `graph_min` | Overrides the global `graph_min` for this entity only. |
| `graph_max` | number | Global `graph_max` | Overrides the global `graph_max` for this entity only. |
| `show_icon` | boolean | Global `show_icon` | Overrides the global `show_icon` for this entity only. |
### Examples
#### 1. Minimal Configuration
The simplest way to use the card is by providing a list of entity IDs.
```yaml
type: custom:background-graph-entities
entities:
- sensor.outside_temperature
- sensor.living_room_humidity
```
#### 2. Basic Configuration
This example sets a title and customizes the appearance of all graphs.
```yaml
type: custom:background-graph-entities
title: Office Sensors
hours_to_show: 48
line_width: 2
line_color: 'var(--primary-color)'
line_opacity: 0.3
entities:
- entity: sensor.office_temperature
name: Temperature
icon: mdi:thermometer
- entity: sensor.office_humidity
name: Humidity
icon: mdi:water-percent
```
#### 3. Advanced Configuration with Overrides
This example demonstrates how to use global settings and override them for specific entities.
```yaml
type: custom:background-graph-entities
title: Advanced Sensor Graphs
hours_to_show: 72
line_color: '#9da0a2' # A default grey color for graphs
line_width: 2
line_opacity: 0.2
curve: linear
line_glow: true
tile_style: true
entities:
# This entity uses the global settings
- entity: sensor.living_room_temperature
# This entity has its own line color and opacity
- entity: sensor.bedroom_temperature
icon: mdi:thermometer-lines
icon_color: '#3498db'
overwrite_graph_appearance: true
line_color: '#3498db' # blue
line_opacity: 0.5
# This entity uses color thresholds, which creates a gradient
- entity: sensor.co2_level
name: CO2 Level
overwrite_graph_appearance: true
color_thresholds:
- value: 400
color: '#2ecc71' # green
- value: 1000
color: '#f1c40f' # yellow
- value: 2000
color: '#e74c3c' # red
# This entity shows a switch but graphs its power sensor
- entity: switch.office_light
name: Office Light
graph_entity: sensor.office_light_power
show_graph_entity_state: true
```
## Development
To contribute to the development, you'll need to set up a build environment.
1. **Clone the repository:**
```bash
git clone https://github.com/timmaurice/lovelace-background-graph-entities.git
cd lovelace-background-graph-entities
```
2. **Install dependencies:**
```bash
npm install
```
3. **Build the card:**
This command will compile the card and place the output in the `dist/` directory.
```bash
npm run build
```
4. In your Home Assistant instance, you will need to configure Lovelace to use the local development version of the card from `dist/background-graph-entities.js`.
---
For further assistance or to report issues, please visit the [GitHub repository](https://github.com/timmaurice/lovelace-background-graph-entities).

## ☕ Support My Work
[ ](https://www.buymeacoffee.com/timmaurice)