https://github.com/tirthajyoti/Interactive_Machine_Learning
IPython widgets, interactive plots, interactive machine learning
https://github.com/tirthajyoti/Interactive_Machine_Learning
analytics animation classification data-science interactive jupyter-notebook machine-learning python regression scikit-learn statistics supervised-learning
Last synced: 5 months ago
JSON representation
IPython widgets, interactive plots, interactive machine learning
- Host: GitHub
- URL: https://github.com/tirthajyoti/Interactive_Machine_Learning
- Owner: tirthajyoti
- License: mit
- Created: 2017-12-09T20:53:11.000Z (over 7 years ago)
- Default Branch: master
- Last Pushed: 2019-04-06T05:19:48.000Z (about 6 years ago)
- Last Synced: 2024-11-16T06:24:44.864Z (5 months ago)
- Topics: analytics, animation, classification, data-science, interactive, jupyter-notebook, machine-learning, python, regression, scikit-learn, statistics, supervised-learning
- Language: Jupyter Notebook
- Homepage:
- Size: 2.57 MB
- Stars: 151
- Watchers: 11
- Forks: 82
- Open Issues: 1
-
Metadata Files:
- Readme: README.md
- License: LICENSE
Awesome Lists containing this project
README
## Please feel free to [add me here on LinkedIn](https://www.linkedin.com/in/tirthajyoti-sarkar-2127aa7/) if you are interested in data science and like to connect.
# Interactive Machine Learning (with [IPython Widgets](https://ipywidgets.readthedocs.io))
[](https://github.com/tirthajyoti/Interactive_Machine_Learning/issues)
[](https://github.com/tirthajyoti/Interactive_Machine_Learning/network)
[](https://github.com/tirthajyoti/Interactive_Machine_Learning/stargazers)
[](https://github.com/tirthajyoti/Interactive_Machine_Learning/pulls)
[](https://github.com/tirthajyoti/Interactive_Machine_Learning/stats/contributors)

## Widgets
Notebooks come alive when interactive widgets are used. Users can visualize and control changes in the data and the model. Learning becomes an immersive, plus fun, experience.
## What is Python Widget?
Project Jupyter was born out of the [IPython Project in 2014](https://ipython.org/) and evolved rapidly to support interactive data science and scientific computing across all major programming languages. There is no doubt that it has left one of the biggest degrees of impact on how a data scientist can quickly test and prototype his/her idea and showcase the work to peers and open-source community.
However, learning and experimenting with data become truly immersive when user can interactively control the parameters of the model and see the effect (almost) real-time. Most of the common rendering in Jupyter are static. However, there is a big effort to introduce elements called ipywidgets, which renders fun and interactive controls on the Jupyter notebook.
> **Widgets are eventful python objects that have a representation in the browser, often as a control like a slider, textbox, etc., through a front-end (HTML/Javascript) rendering channel.**
## What is the demo in this Repo?
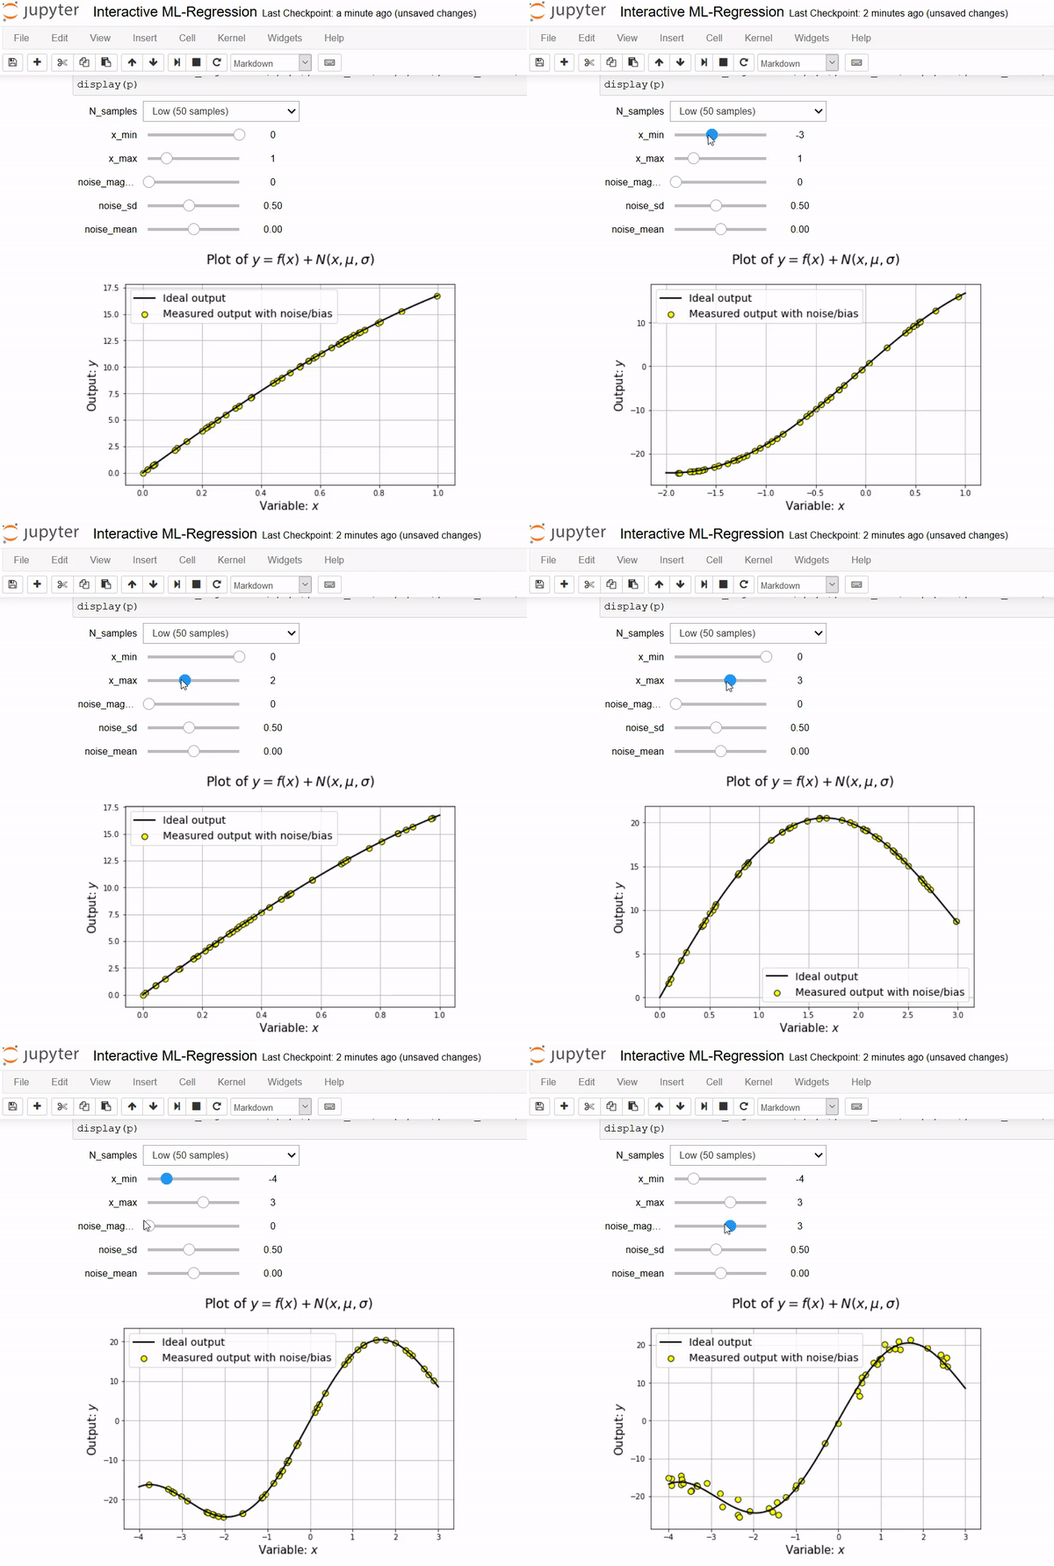
We demonstrate simple linear regression of single variable using interactive control elements. Note, the idea can be extended for complex multi-variate, nonlinear, kernel based regression easily. However, just for simplicity of visualization, we stick to single variable case in this demo.
First, we show the data generation process as a function of input variables and statistical properties of the associated noise.
Next, We introduce interactive control for the following hyperparameters.
* ***Model complexity*** (degree of polynomial)
* ***Regularization type*** — LASSO or Ridge
* ***Size of the test set*** (fraction of total sample data used in test)
User can interact with the linear regression model using these controls. Note, how the test and training scores are also updated dynamically to show a trend of over-fitting or under-fitting as the model complexity changes. One can go back to the data generation control and increase of decrease the noise magnitude to see its impact on the fitting quality and bias/variance trade-off.
[***Check this article***](https://towardsdatascience.com/interactive-machine-learning-make-python-lively-again-a96aec7e1627) I wrote on Medium about this project.