https://github.com/tomarus/chart
Go Chart Lib
https://github.com/tomarus/chart
chart charts golang png svg time-series
Last synced: 11 months ago
JSON representation
Go Chart Lib
- Host: GitHub
- URL: https://github.com/tomarus/chart
- Owner: tomarus
- License: mit
- Created: 2017-05-14T21:01:23.000Z (about 9 years ago)
- Default Branch: master
- Last Pushed: 2019-01-31T09:10:32.000Z (over 7 years ago)
- Last Synced: 2025-08-13T22:04:55.351Z (11 months ago)
- Topics: chart, charts, golang, png, svg, time-series
- Language: Go
- Size: 72.3 KB
- Stars: 36
- Watchers: 2
- Forks: 5
- Open Issues: 0
-
Metadata Files:
- Readme: README.md
- License: LICENSE
Awesome Lists containing this project
README
[](https://travis-ci.org/tomarus/chart)
[](https://coveralls.io/github/tomarus/chart?branch=master)
[](https://goreportcard.com/report/github.com/tomarus/chart)
[](https://godoc.org/github.com/tomarus/chart)
# Go Chart Lib
Dead simple rrd like bandwidth charts with focus on pixel perfect rendering of source data.
Written in Go, the output can either be an interactive SVG chart or a static PNG image.
It was written to be able to show tens or hundreds of charts in seconds without interactivity in mind.
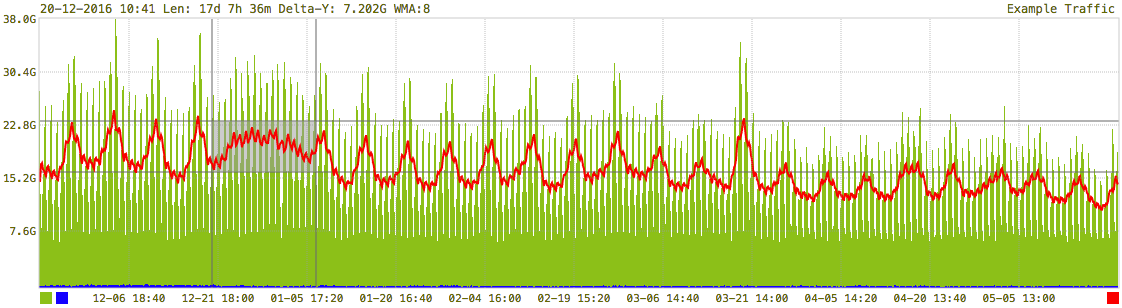
The SVG image allows basic analytics to be performed on the chart, like measurements of time or volume, showing/hiding datasets and showing a weighted moving average on demand.
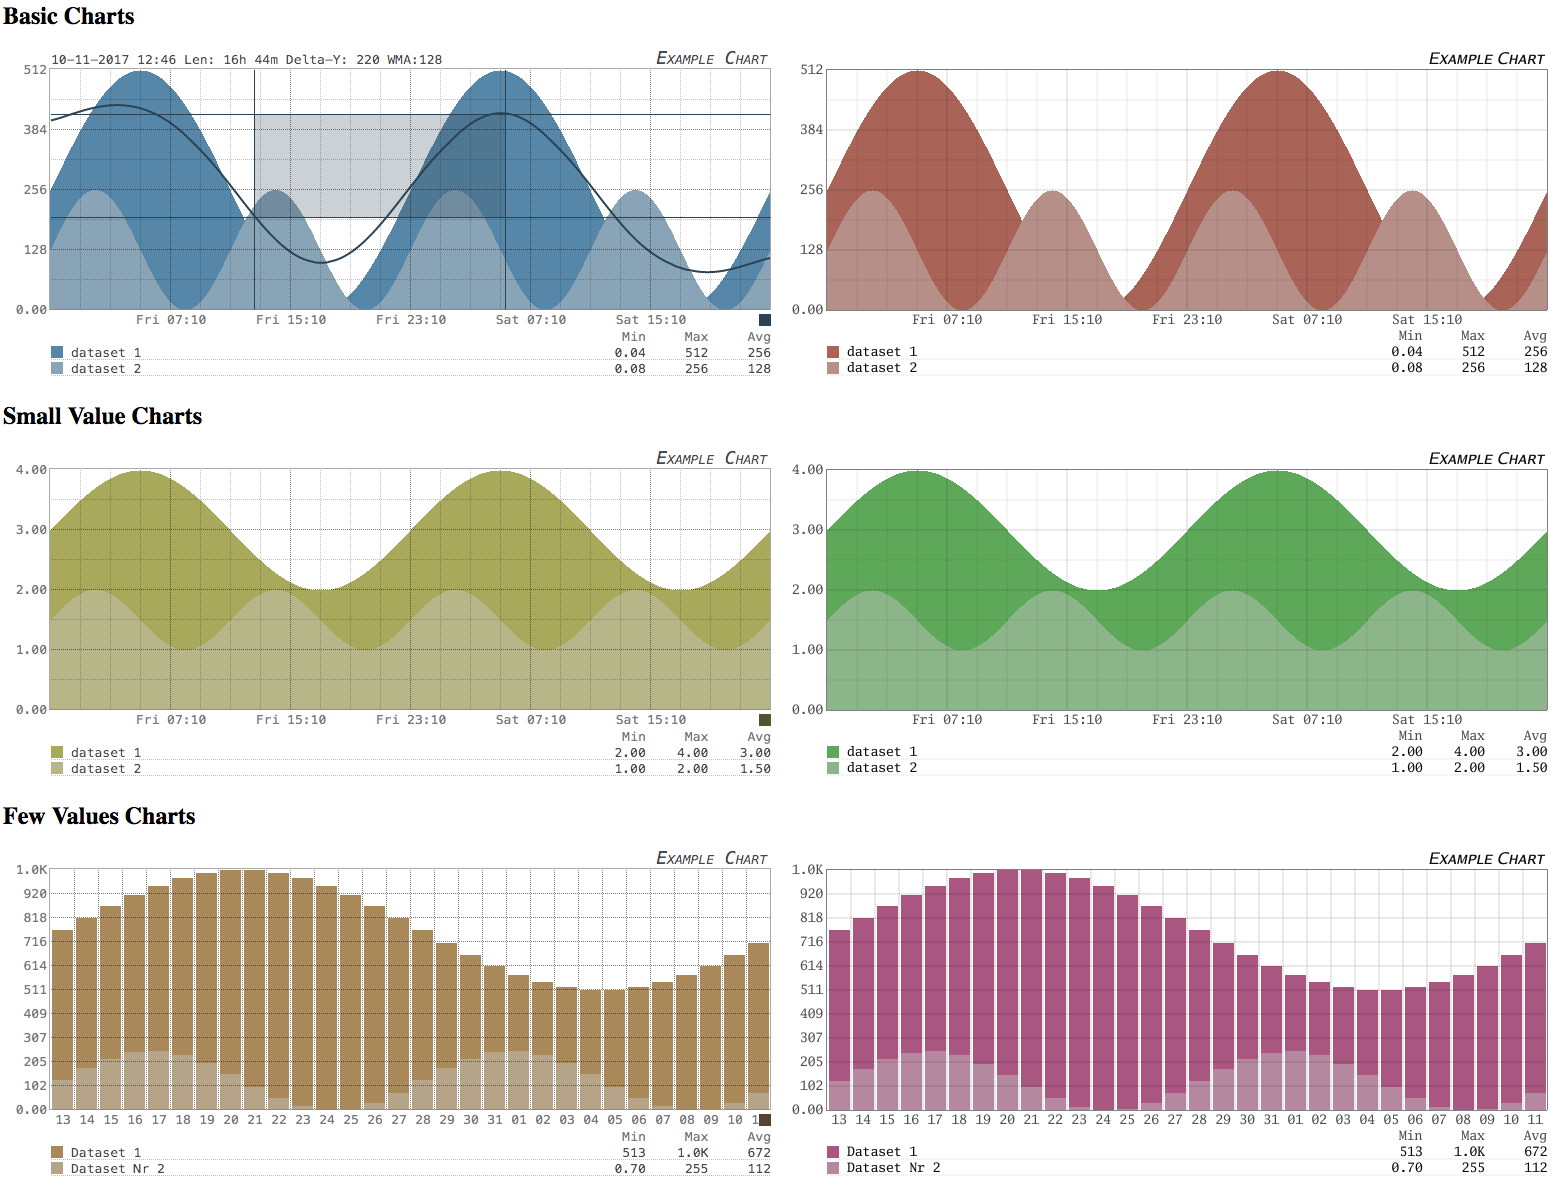
Source data can be upsampled using a simple stretch method (bar charts) or downsampled using the largest triangle three buckets algorithm.
The javascript embedded in the SVG image does not have any dependencies.
## Examples
Example screenshot:
[View as interactive SVG](http://s.chiparus.org/6/6b15c5349e894fe9.svg)
Screenshots from the example website:
## Example Usage
Example demo app:
```
go get github.com/tomarus/chart
go run $GOPATH/src/github.com/tomarus/chart/examples/main.go
open http://localhost:3000
```
Example /proc monitoring app (linux only):
```
go get github.com/tomarus/chart
go run $GOPATH/src/github.com/tomarus/chart/examples/sysmon/main.go
open http://localhost:3001
```
Code example:
```go
import (
"github.com/tomarus/chart"
"github.com/tomarus/chart/svg"
)
opts := &chart.Options{
Title: "Traffic",
Image: svg.New(), // or png.New()
Size: "auto", // big is 1440px, small is 720px, auto is size of dataset
Height: 300, // Defaults to -1, when size=auto height=width/4, otherwise set fixed height
Scheme: "white", // or black/random/pink/solarized or hsl:180,0.5,0.25
Start: start_epoch,
End: end_epoch,
W: w,
SIBase: 1000, // or use 1024 to scale, only used when axes are not specified.
// If you don't specify axes, they will be automatically calculated using some defaults.
Axes: []*axis.Axis{
axis.NewTime(axis.Bottom, "Mon 15:04").Duration(8 * time.Hour).Grid(4),
axis.NewSI(axis.Left, 1000).Ticks(4).Grid(2),
},
}
c, err := chart.NewChart(opts)
if err != nil {
panic(err)
}
err = c.AddData(&data.Options{Title: "My Data Description"}, []yourData)
if err != nil {
panic(err)
}
w.Header().Set("Content-Type", "image/svg+xml")
err = c.Render()
if err != nil {
panic(err)
}
```
## Notes
This is an experimental work in progress for my own personal educational and research purposes.
This project has just started and a lot of stuf is still missing or incomplete. The API will not be stable until 1.0.0 is tagged in git.
This is a small list of ideas, todos and limitations:
* Custom lines and markers, like 95th percentile line, downtime markers, etc
* Add support negative values
* It supports only area charts atm
* Only 4 sources per chart supported currently