https://github.com/toolsu/ccost
Analyze Claude Code token usage and costs from local conversation logs and statusline data
https://github.com/toolsu/ccost
anthropic claude claude-code cost token usage
Last synced: 3 months ago
JSON representation
Analyze Claude Code token usage and costs from local conversation logs and statusline data
- Host: GitHub
- URL: https://github.com/toolsu/ccost
- Owner: toolsu
- License: mit
- Created: 2026-03-26T13:23:20.000Z (3 months ago)
- Default Branch: main
- Last Pushed: 2026-04-02T21:03:12.000Z (3 months ago)
- Last Synced: 2026-04-03T04:32:08.612Z (3 months ago)
- Topics: anthropic, claude, claude-code, cost, token, usage
- Language: Rust
- Homepage:
- Size: 1.54 MB
- Stars: 1
- Watchers: 0
- Forks: 0
- Open Issues: 0
-
Metadata Files:
- Readme: README.md
- License: LICENSE
Awesome Lists containing this project
README
# ccost 
Analyze Claude Code token usage and costs from local conversation logs and statusline data.
Reads JSONL files from `~/.claude/projects/`, deduplicates streaming entries, calculates costs using LiteLLM pricing, and outputs as table, JSON, Markdown, HTML, CSV, TSV, or braille chart (See [Screenshot](#screenshots)).
The [`ccost sl` subcommand](#statusline-analysis) ([setup statusline.jsonl first](#setup-for-statuslinejsonl)) analyzes `~/.claude/statusline.jsonl` for rate limit tracking, session summaries, budget estimation, and cost comparison (see [`ccost` vs `ccost sl`](#ccost-vs-ccost-sl)).
Blazing fast CLI and library written in Rust with thorough tests. Also powers [CC Dashboard for Claude Code](https://github.com/toolsu/ccdashboard), a Tauri desktop app for visualizing your Claude Code usage and more.
[](https://crates.io/crates/ccost) [](https://www.npmjs.com/package/ccost) [](https://github.com/toolsu/ccost/actions/workflows/ci.yml) [](https://github.com/toolsu/ccost/blob/main/LICENSE)
[中文文档](https://github.com/toolsu/ccost/blob/main/README.zh.md)
## Install
```bash
npm i -g ccost
```
Or download prebuilt binaries from [GitHub Releases](https://github.com/toolsu/ccost/releases).
Or via Cargo (compiles from source):
```bash
cargo install ccost
```
## Quick Start
```bash
ccost # default: by day, then by model
ccost --from 2026-03-01 --to 2026-03-31 # date range
ccost --per model --cost decimal # by model, 2-decimal cost
ccost --chart cost # cost chart over time
ccost sl # 5h rate-limit windows (default)
ccost sl --per action # rate limit timeline
ccost sl --per 5h --cost decimal # budget estimation
ccost sl --chart 5h # rate limit chart
```
## CLI Reference
### Grouping
| Flag | Description |
|------|-------------|
| `--per ` | Group by: `day`, `hour`, `month`, `session`, `project`, `model`. Up to 2 for nested grouping. Default: `--per day --per model`. |
| `--order ` | Sort: `asc` (default) or `desc`. |
Two-level grouping creates parent-child rows, e.g. `--per day --per model` shows each day with per-model breakdowns.
### Date Filtering
| Flag | Description |
|------|-------------|
| `--from ` | Start date (inclusive). `YYYY-MM-DD` or `YYYY-MM-DDTHH:MM:SS`. |
| `--to ` | End date (inclusive). |
| `--5hfrom`, `--5hto` | 5-hour window starting/ending at given time. |
| `--1wfrom`, `--1wto` | 1-week window starting/ending at given time. |
`--5hfrom`/`--5hto` are mutually exclusive. Same for `--1wfrom`/`--1wto`. The `5h` and `1w` shortcuts cannot be combined with `--from`/`--to`.
### Record Filtering
| Flag | Description |
|------|-------------|
| `--project ` | Filter by project path (case-insensitive substring). |
| `--model ` | Filter by model name (case-insensitive substring). |
| `--session ` | Filter by session ID (case-insensitive substring). |
### Timezone
| Flag | Description |
|------|-------------|
| `--tz ` | `UTC`, fixed offset (`+08:00`), or IANA name (`Asia/Shanghai`). Default: local. |
### Cost Display
| Flag | Description |
|------|-------------|
| `--cost ` | `true` (default): integer `$1`. `decimal`: `$1.23`. `false`: hide costs. |
### Output
| Flag | Description |
|------|-------------|
| `--output ` | `json`, `markdown`, `html`, `txt`, `csv`, `tsv`. Writes to file (default: `ccost.`). |
| `--filename ` | Custom output filename. |
| `--table ` | `auto` (default), `full`, `compact`. Auto picks compact when terminal < 120 cols. |
| `--copy ` | Copy to clipboard. Uses `pbcopy`/`xclip`/`wl-copy`/OSC52. Independent of `--output`. |
### Chart
| Flag | Description |
|------|-------------|
| `--chart ` | Braille line chart: `cost` or `token`. |
Granularity auto-selects based on range (hour/day/month). Only `--output txt` works with `--chart`.
### Pricing
| Flag | Description |
|------|-------------|
| `--live-pricing` | Fetch latest from LiteLLM (requires network). |
| `--pricing-data ` | Custom pricing JSON file. |
### Other
| Flag | Description |
|------|-------------|
| `--claude-dir ` | Override Claude config directory. Default: `~/.claude` and `~/.config/claude`. |
| `--help` | Show help. |
| `--version` | Show version. |
## Statusline Analysis
`ccost sl` command can analyze `~/.claude/statusline.jsonl`, a file produced by a Claude Code statusline hook that snapshots rate limits, cost, duration, and context window usage on every action (see [`ccost` vs `ccost sl`](#ccost-vs-ccost-sl)).
### Setup for statusline.jsonl
#### Automatic Setup
Run in Claude Code on any OS:
```
/statusline Set up a command-type statusline using ~/.claude/statusline.sh (or ~/.claude/statusline.ps1 on Windows). The script should read stdin and append {"ts":,"data":} to ~/.claude/statusline.jsonl. Create the script and configure settings.json.
```
#### Manual Setup
##### Linux, macOS, WSL
Or set it up manually: add to `~/.claude/settings.json`:
```json
"statusLine": {
"type": "command",
"command": "~/.claude/statusline.sh"
}
```
Create `~/.claude/statusline.sh`:
```bash
#!/bin/bash
input=$(cat)
echo "{\"ts\":$(date +%s),\"data\":$input}" >> ~/.claude/statusline.jsonl
```
```sh
chmod +x ~/.claude/statusline.sh
```
If you already have a statusline script, just append the `echo` line.
##### Windows (PowerShell)
Add to `~/.claude/settings.json`:
```json
"statusLine": {
"type": "command",
"command": "powershell -NoProfile -File ~/.claude/statusline.ps1"
}
```
Create `~/.claude/statusline.ps1`:
```powershell
$input = $Input | Out-String
$ts = [int](New-TimeSpan -Start (Get-Date '1970-01-01') -End (Get-Date).ToUniversalTime()).TotalSeconds
$line = "{""ts"":$ts,""data"":" + $input.Trim() + "}"
Add-Content -Path "$env:USERPROFILE\.claude\statusline.jsonl" -Value $line -Encoding UTF8
```
### View Modes
| Command | Description |
|---------|-------------|
| `ccost sl` | 5-hour windows (default) |
| `ccost sl --per action` | Rate limit timeline with per-action cost |
| `ccost sl --per session` | By session |
| `ccost sl --per project` | By project |
| `ccost sl --per day` | By day |
| `ccost sl --per 1h` | 1-hour windows within 5h windows |
| `ccost sl --per 5h` | 5-hour rate-limit windows |
| `ccost sl --per 1w` | 1-week rate-limit windows |
| `ccost sl --chart 5h` | 5-hour rate limit % chart |
| `ccost sl --chart 1w` | 1-week rate limit % chart |
| `ccost sl --chart cost` | Cumulative cost chart |
The `session/project/day/1h/5h/1w` views share columns: `Cost`, `Duration`, `API Time`, `Lines +/-`, `Sess`, `5h%`, `1w%`. Window views (`1h/5h/1w`) add `Est 5h Budget` or `Est 1w Budget`. The `1h` view also adds `5h Resets`. The `action` view has its own layout: `Time`, `Cost`, `5h%`, `1w%`, `5h Resets`, `Session`.
The `5h%` and `1w%` columns show the observed min-max range (e.g. `1-29%`).
### Statusline Flags
| Flag | Description |
|------|-------------|
| `--file ` | Statusline file. Default: `~/.claude/statusline.jsonl`. |
| `--nopromo` | Disable promo adjustment for budget estimation. See below. |
| `--cost-diff` | Compare statusline cost with LiteLLM pricing. Only with `--per session`. |
All shared flags (`--from`, `--to`, `--tz`, `--session`, `--project`, `--model`, `--cost`, `--output`, `--filename`, `--copy`, `--order`, `--table`) work with `ccost sl`.
### Segments and Continued Sessions
When a session is closed and resumed, cumulative counters reset to zero. `ccost sl` detects these resets and sums across segments correctly.
When a session is continued via `claude --continue`, a new session ID is created but cumulative counters (cost, duration, lines) carry over from the predecessor without resetting. `ccost sl` detects this by subtracting each session's first record values as a baseline, so only the work done in the current session instance is counted.
Rate limits are account-level and do not reset with sessions.
Note: `--per day` assigns each session to the day it started. Sessions spanning midnight are not split.
### Budget Estimation
Window views estimate the total rate-limit budget from cost and the delta in rate-limit percentage:
```
Est 5h Budget = Cost * 100 / delta_5h% (for --per 1h and --per 5h)
Est 1w Budget = Cost * 100 / delta_1w% (for --per 1w)
```
Where `delta% = max% - min%` within the window. This uses how much of the rate limit was actually consumed, not the absolute peak.
Since `ccost sl` only sees Claude Code cost, usage from other Claude products (web, desktop, mobile) inflates the denominator without increasing the numerator. This makes the estimate a **lower bound** on the real budget, with the gap proportional to non-CC usage.
### Promo Adjustment
Budget estimates (and **only** budget estimates ("Est 5h/1w Budget")) are adjusted by default for known 2x usage promo periods (Dec 2025, Mar 2026). During these promos the rate-limit budget doubles, so the same spend uses half the percentage. Use `--nopromo` to disable:
```sh
ccost sl --per 5h --nopromo
```
For windows that partially overlap a promo period, the adjustment scales proportionally.
## Examples
```bash
# HTML report with decimal cost
ccost --per project --cost decimal --output html --filename report.html
# Filter to a specific session
ccost --session abc123 --from 2026-03-23
# UTC, descending
ccost --tz UTC --order desc --from 2026-03-01
# Opus models only, no cost
ccost --model opus --cost false
# 5-hour window from a specific time
ccost --5hfrom 2026-03-24T10:00:00
# Live pricing
ccost --live-pricing
# Cost chart for last week
ccost --chart cost --1wto 2026-03-25
# CSV by month
ccost --per month --output csv --filename usage.csv
# Two-level: project > model
ccost --per project --per model --table full
# Copy JSON to clipboard
ccost --copy json
# Statusline: budget estimation
ccost sl --per 5h --cost decimal
# Statusline: cost comparison
ccost sl --per session --cost-diff --cost decimal
# Statusline: rate limit chart
ccost sl --chart 5h
```
## Library API
ccost is also a Rust library.
```toml
[dependencies]
ccost = { path = "../ccost" }
```
### Pipeline
```
load_records -> calculate_cost -> group_records -> format_*
```
```rust
use ccost::*;
let options = LoadOptions {
from: Some("2026-03-01".to_string()),
to: Some("2026-03-31".to_string()),
tz: Some("UTC".to_string()),
model: Some("opus".to_string()),
..Default::default()
};
let result = load_records(&options);
let pricing = load_pricing();
let priced = calculate_cost(&result.records, Some(&pricing));
let dimensions = vec![GroupDimension::Day, GroupDimension::Model];
let group_options = GroupOptions {
order: SortOrder::Asc,
tz: Some("UTC".to_string()),
};
let grouped = group_records(&priced, &dimensions, Some(&group_options));
use ccost::formatters::table::TableOptions;
let table_opts = TableOptions {
dimension_label: "Date/Model".to_string(),
price_mode: PriceMode::Decimal,
compact: false,
color: Some(true),
};
let table = format_table(&grouped.data, &grouped.totals, &table_opts);
print!("{}", table);
```
### Key Types
```rust
struct LoadOptions {
claude_dir: Option,
from: Option, // YYYY-MM-DD or YYYY-MM-DDTHH:MM:SS
to: Option,
tz: Option, // UTC, +HH:MM, or IANA name
project: Option, // substring filter
model: Option,
session: Option,
}
enum GroupDimension { Day, Hour, Month, Session, Project, Model }
struct GroupedData {
label: String,
input_tokens: u64,
output_tokens: u64,
cache_creation_tokens: u64,
cache_read_tokens: u64,
input_cost: f64,
cache_creation_cost: f64,
cache_read_cost: f64,
output_cost: f64,
total_cost: f64,
children: Option>,
}
```
### Formatters
| Function | Output |
|----------|--------|
| `format_table()` | Unicode box-drawing table with optional ANSI colors |
| `format_txt()` | Same table, no colors |
| `format_json()` | JSON with `meta`, `data`, `totals`, `dedup` |
| `format_markdown()` | GFM Markdown table |
| `format_html()` | Self-contained HTML with sortable columns |
| `format_csv()` | RFC 4180 CSV |
| `format_tsv()` | Tab-separated values |
| `render_chart()` | Braille line chart |
## How It Works
### Data Source
Reads JSONL conversation logs from Claude Code's local storage:
- `~/.claude/projects/*/` (session files and `subagents/`)
- `~/.config/claude/projects/*/` (alternate location)
Both are scanned and deduplicated via symlink detection. Subagent transcripts are found in both the old (`/subagents/`) and new (`//subagents/`) directory structures.
### Deduplication
Streaming entries share the same `messageId:requestId` key with increasing `output_tokens`. Only the highest-output record per key is kept. This dedup is global across all files, preventing double-counting between parent sessions and subagent files.
### Pricing
Per-record cost via model-to-price lookup:
1. Exact match
2. Strip date suffix (`-YYYYMMDD` / `@YYYYMMDD`), retry
3. Substring match among `claude-*` keys
Bundled at compile time from LiteLLM. Use `--live-pricing` for latest or `--pricing-data` for custom.
### `ccost` vs `ccost sl`
Below we'll compare `ccost` (data from `~/.claude/projects/`) and `ccost sl` (data from `statusline.jsonl`).
`~/.claude/projects/` contains per-request JSONL logs with detailed token counts (input, output, cache creation, cache read) for every API call. `ccost` computes cost from these counts using LiteLLM pricing.
`~/.claude/statusline.jsonl` contains periodic snapshots from Claude Code's statusline, including the server-reported cumulative cost and the 5-hour and 1-week rate-limit usage percentages, which are not available anywhere else.
As shown by `ccost sl --per session --cost-diff`, when LiteLLM pricing is accurate, the cost computed from `~/.claude/projects/` closely matches the server-reported cost in `statusline.jsonl`. The statusline cost may occasionally undercount because it does not always include subagent costs. Since `~/.claude/projects/` has full per-request token breakdowns, it may be the more reliable source for cost.
The primary value of `statusline.jsonl` is the rate-limit percentages, not cost. This is why [CC Dashboard for Claude Code](https://github.com/toolsu/ccdashboard) uses cost data computed from `~/.claude/projects/` combined with the 5-hour and 1-week rate-limit percentages from `statusline.jsonl`.
### Project Path Decoding
Directory names like `-home-user-workspace-test` decode to `/home/user/workspace/test`.
## Screenshots
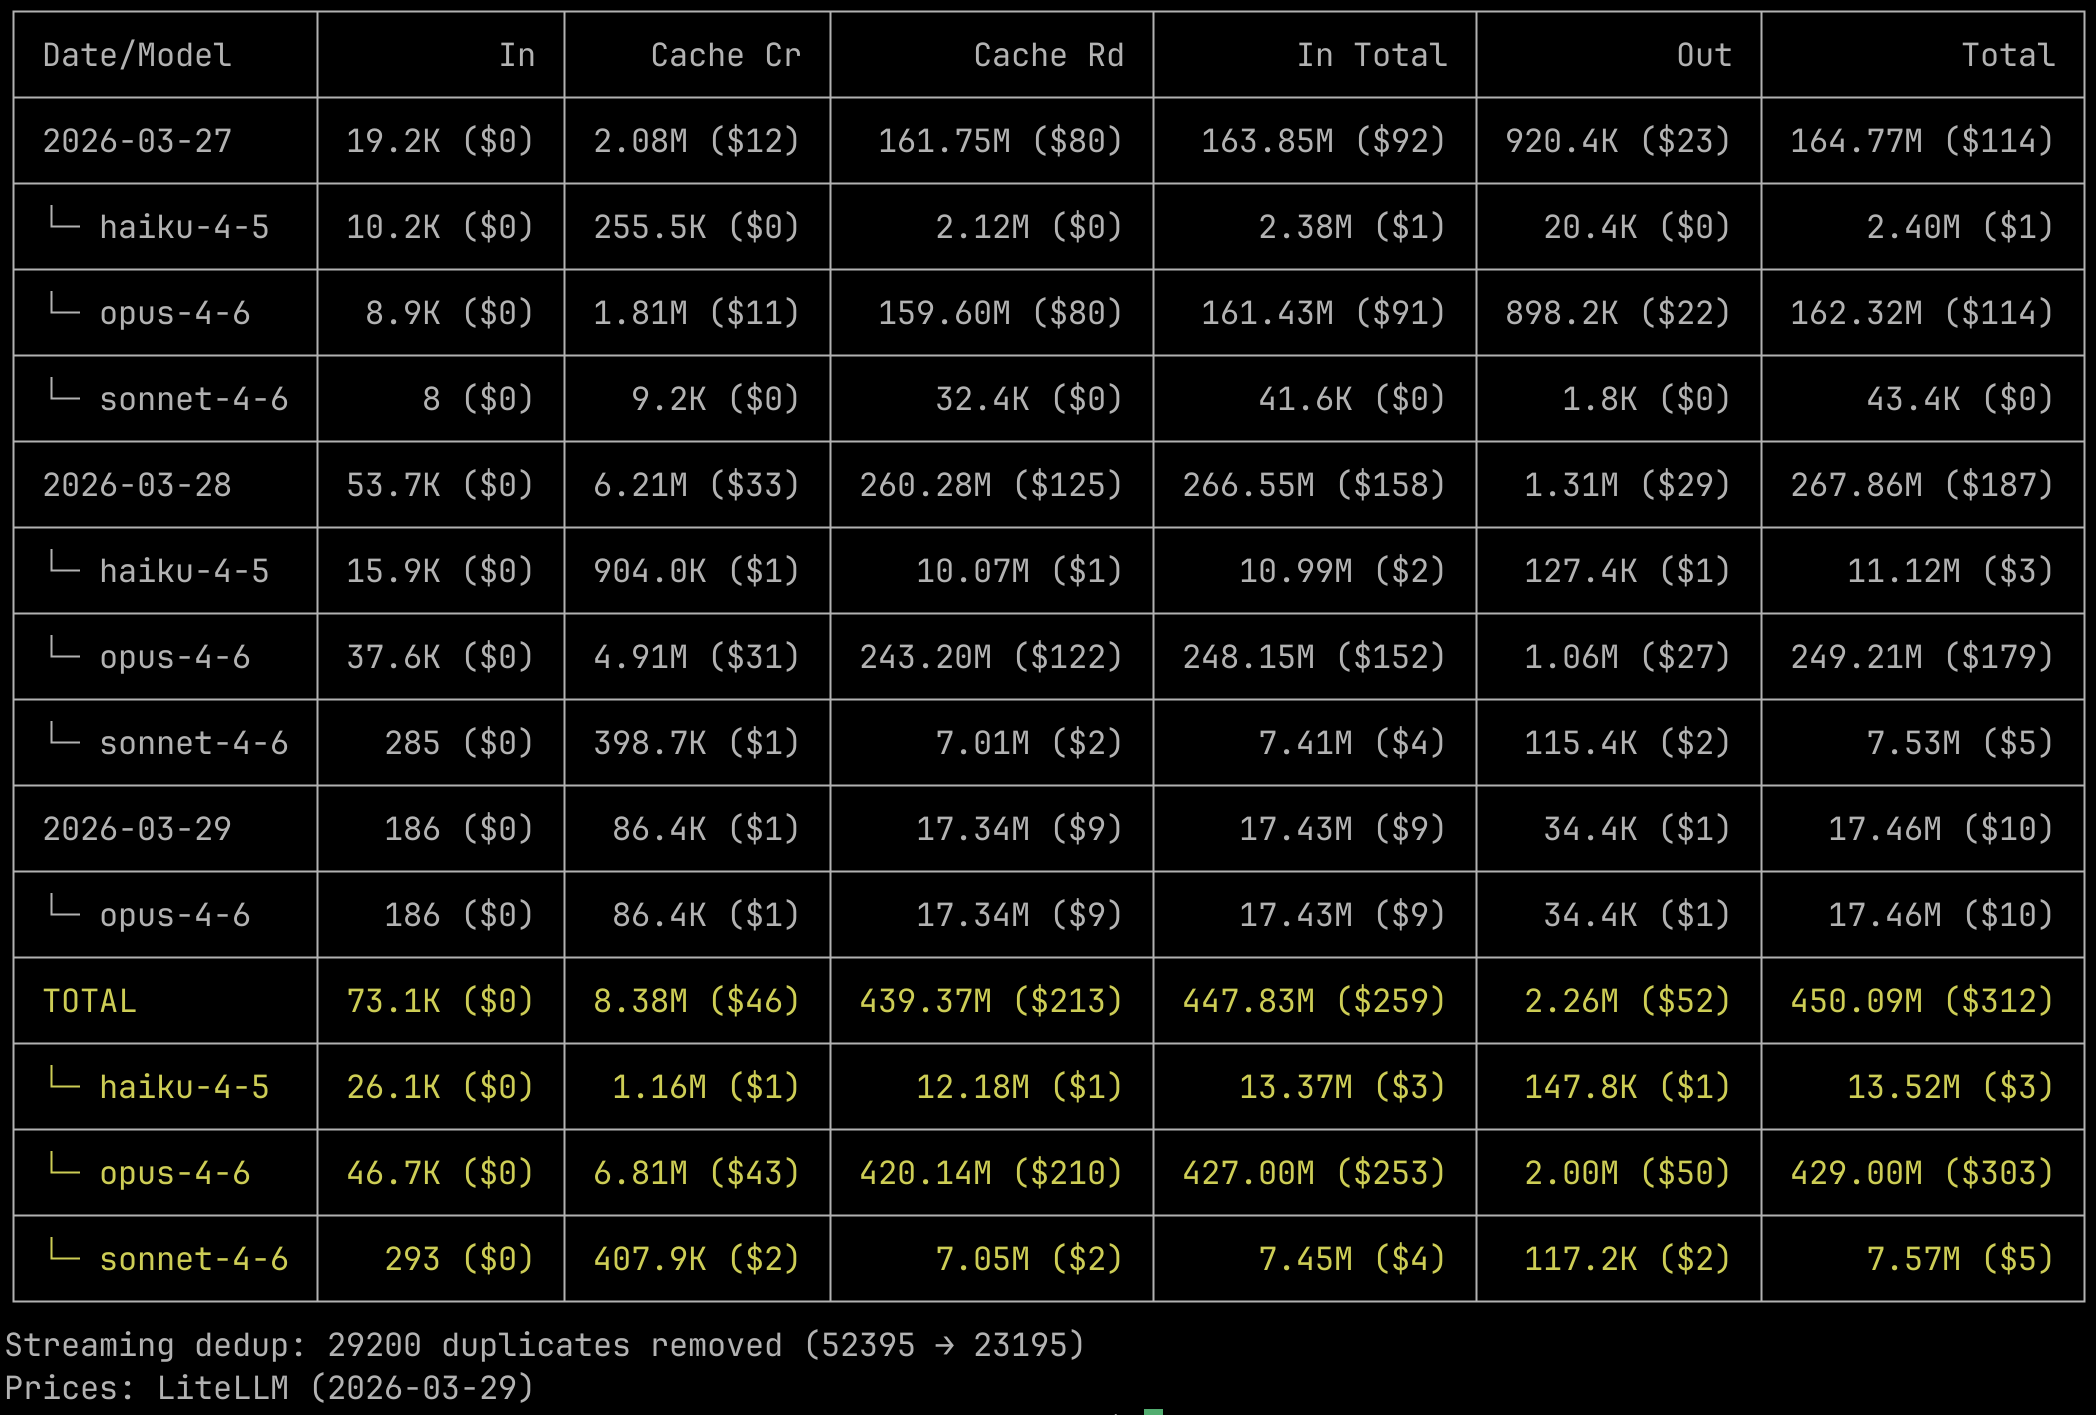
### Terminal
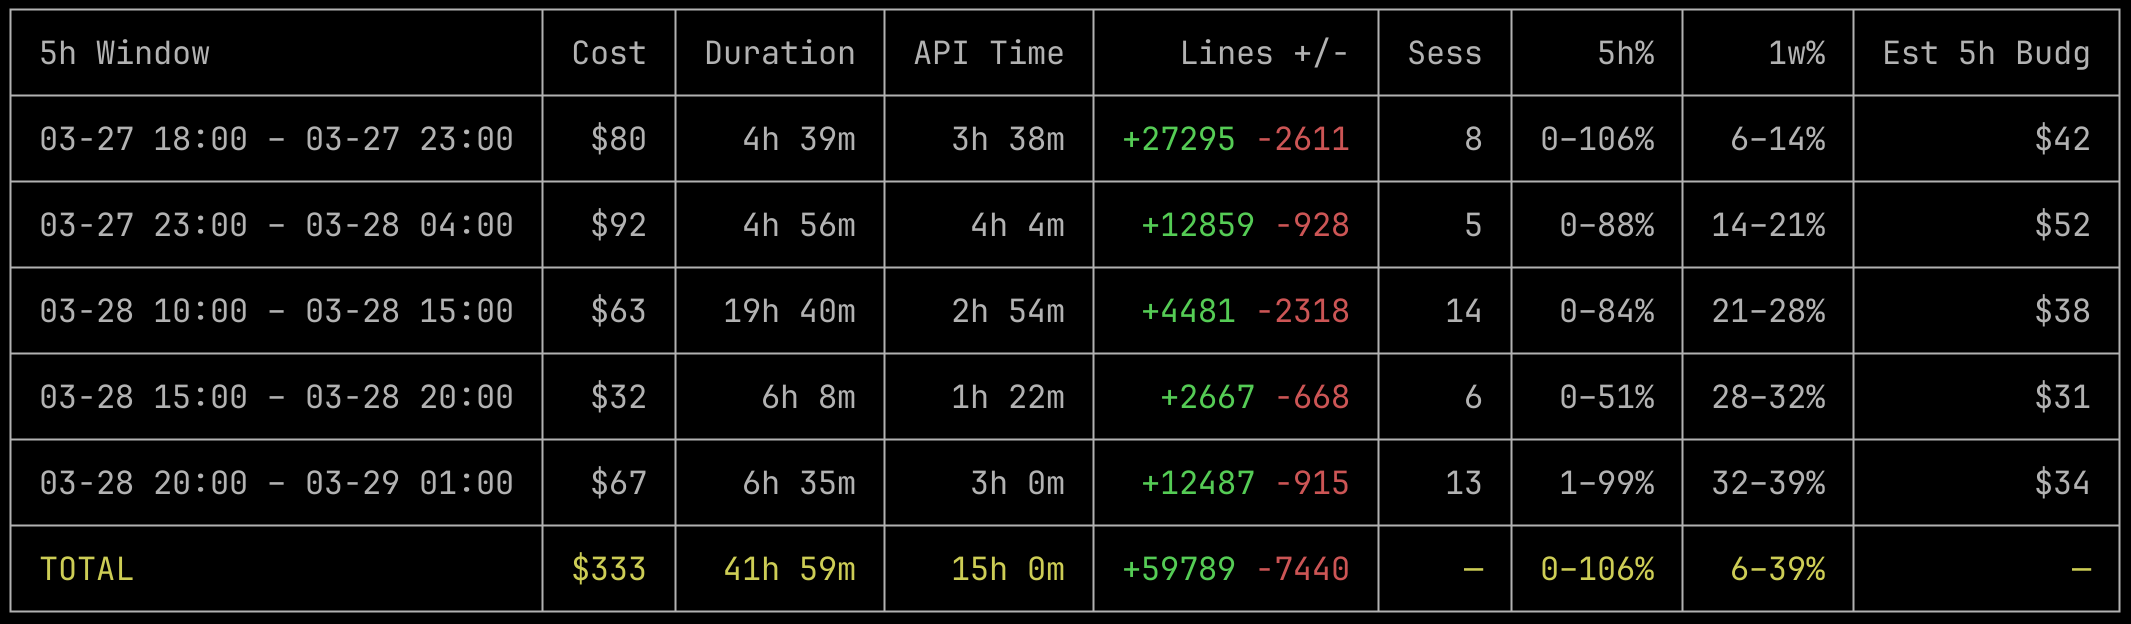
### Statusline Analysis (`ccost sl`)
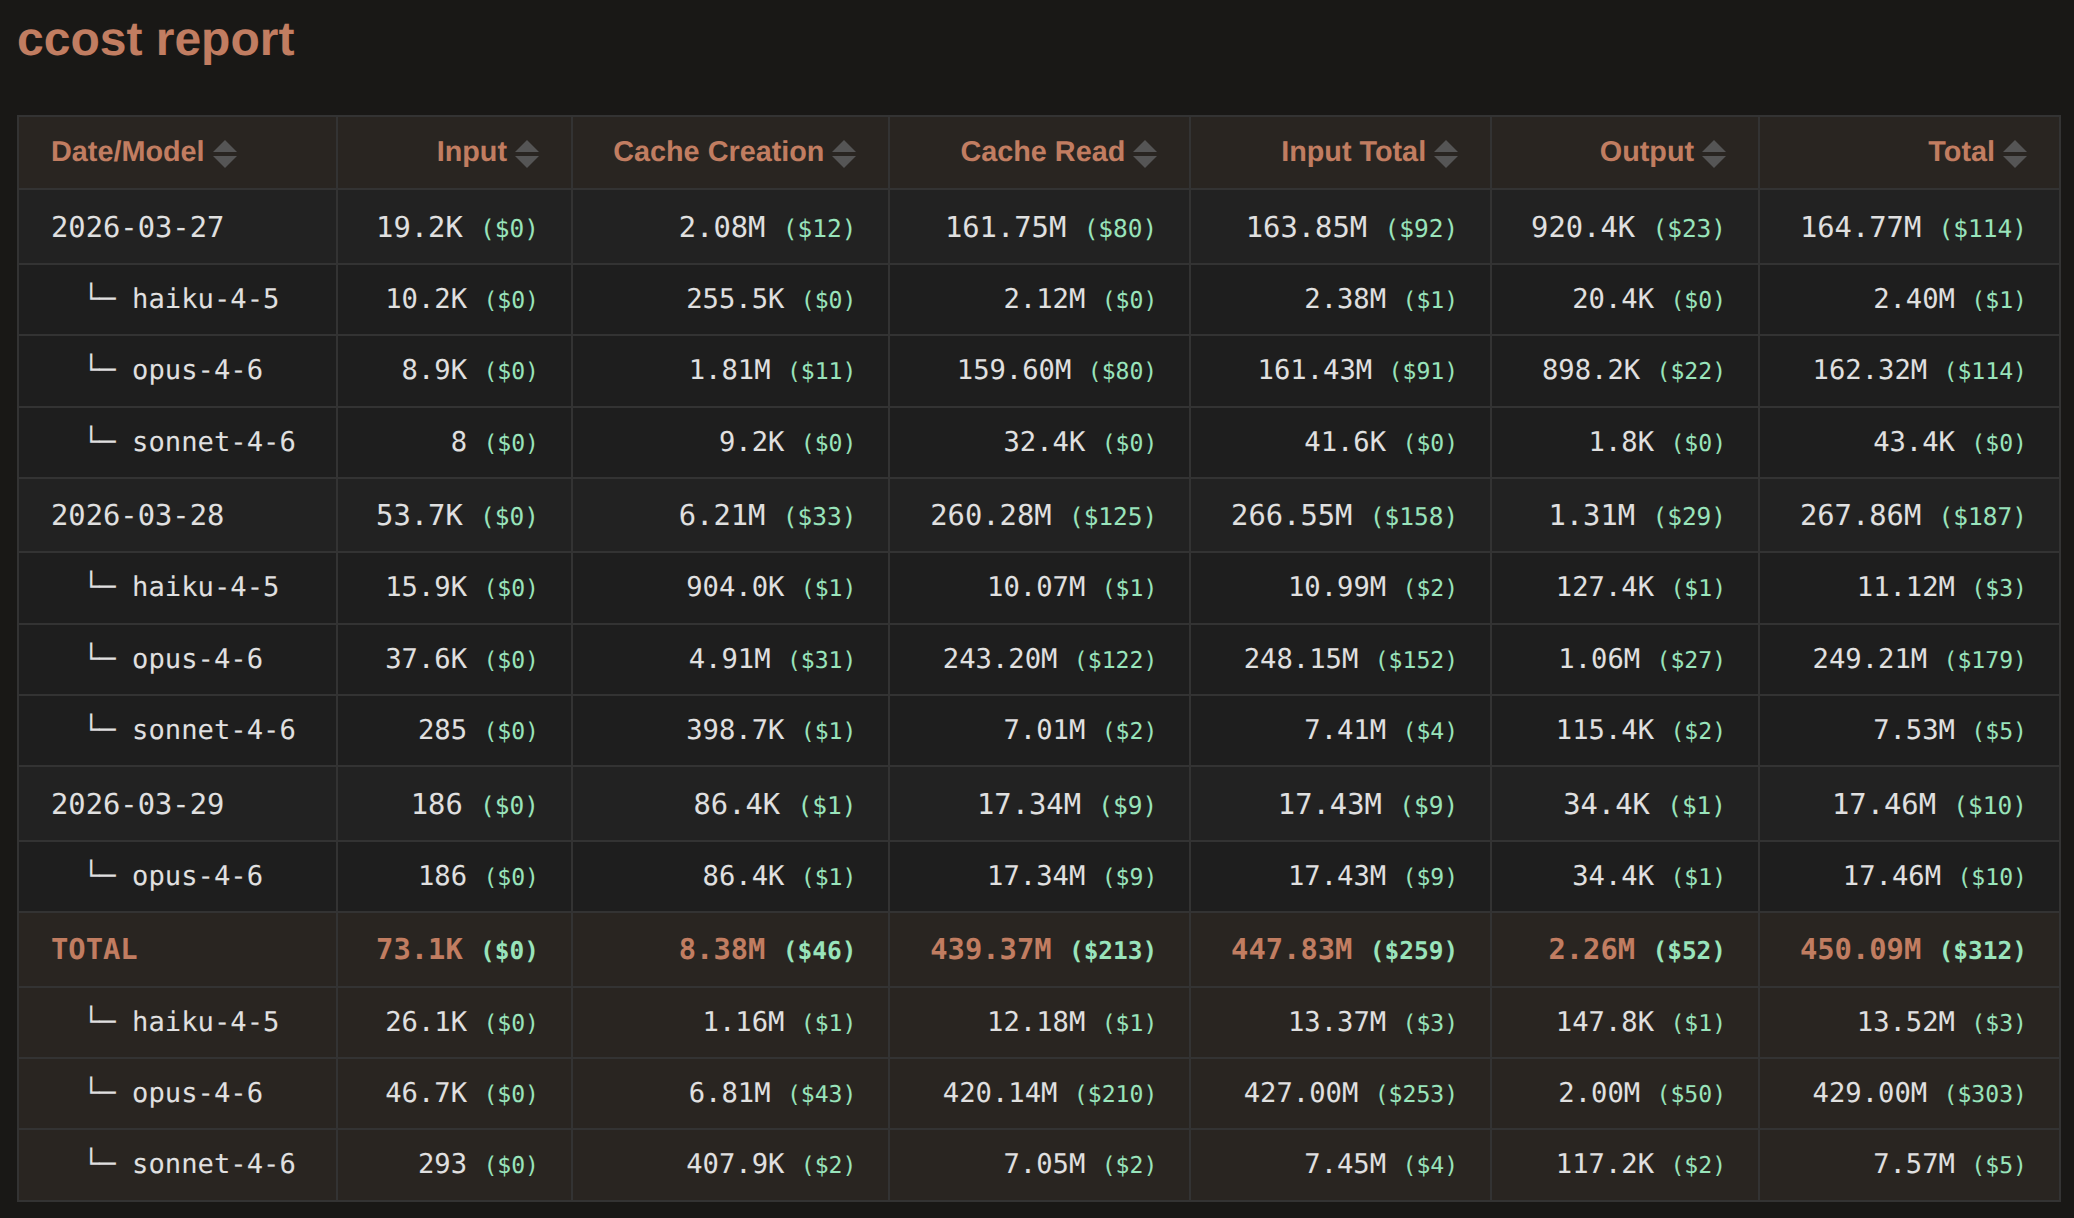
### HTML Report
## Development
```bash
cargo test # run all tests
cargo build --release # optimized build
cargo run -- --help # CLI help
```
## License
MIT