https://github.com/twinedo/rn-netinspect
Inspect React Native network requests across simulator, emulator, and real devices.
https://github.com/twinedo/rn-netinspect
android axios debugging expo fetch ios network-inspector proxy react-native xhr
Last synced: 9 days ago
JSON representation
Inspect React Native network requests across simulator, emulator, and real devices.
- Host: GitHub
- URL: https://github.com/twinedo/rn-netinspect
- Owner: twinedo
- License: mit
- Created: 2026-03-17T08:23:21.000Z (4 months ago)
- Default Branch: main
- Last Pushed: 2026-06-25T04:43:33.000Z (14 days ago)
- Last Synced: 2026-06-25T06:19:17.546Z (14 days ago)
- Topics: android, axios, debugging, expo, fetch, ios, network-inspector, proxy, react-native, xhr
- Language: JavaScript
- Homepage: https://www.npmjs.com/package/@twinedo/rn-netinspect
- Size: 270 KB
- Stars: 2
- Watchers: 0
- Forks: 0
- Open Issues: 0
-
Metadata Files:
- Readme: README.md
- Changelog: CHANGELOG.md
- License: LICENSE
Awesome Lists containing this project
README
React Native NetInspect
Inspect React Native traffic across simulator, emulator, and real devices.




Dashboard on :19826. Optional proxy on :8899. Direct capture from fetch and XMLHttpRequest.
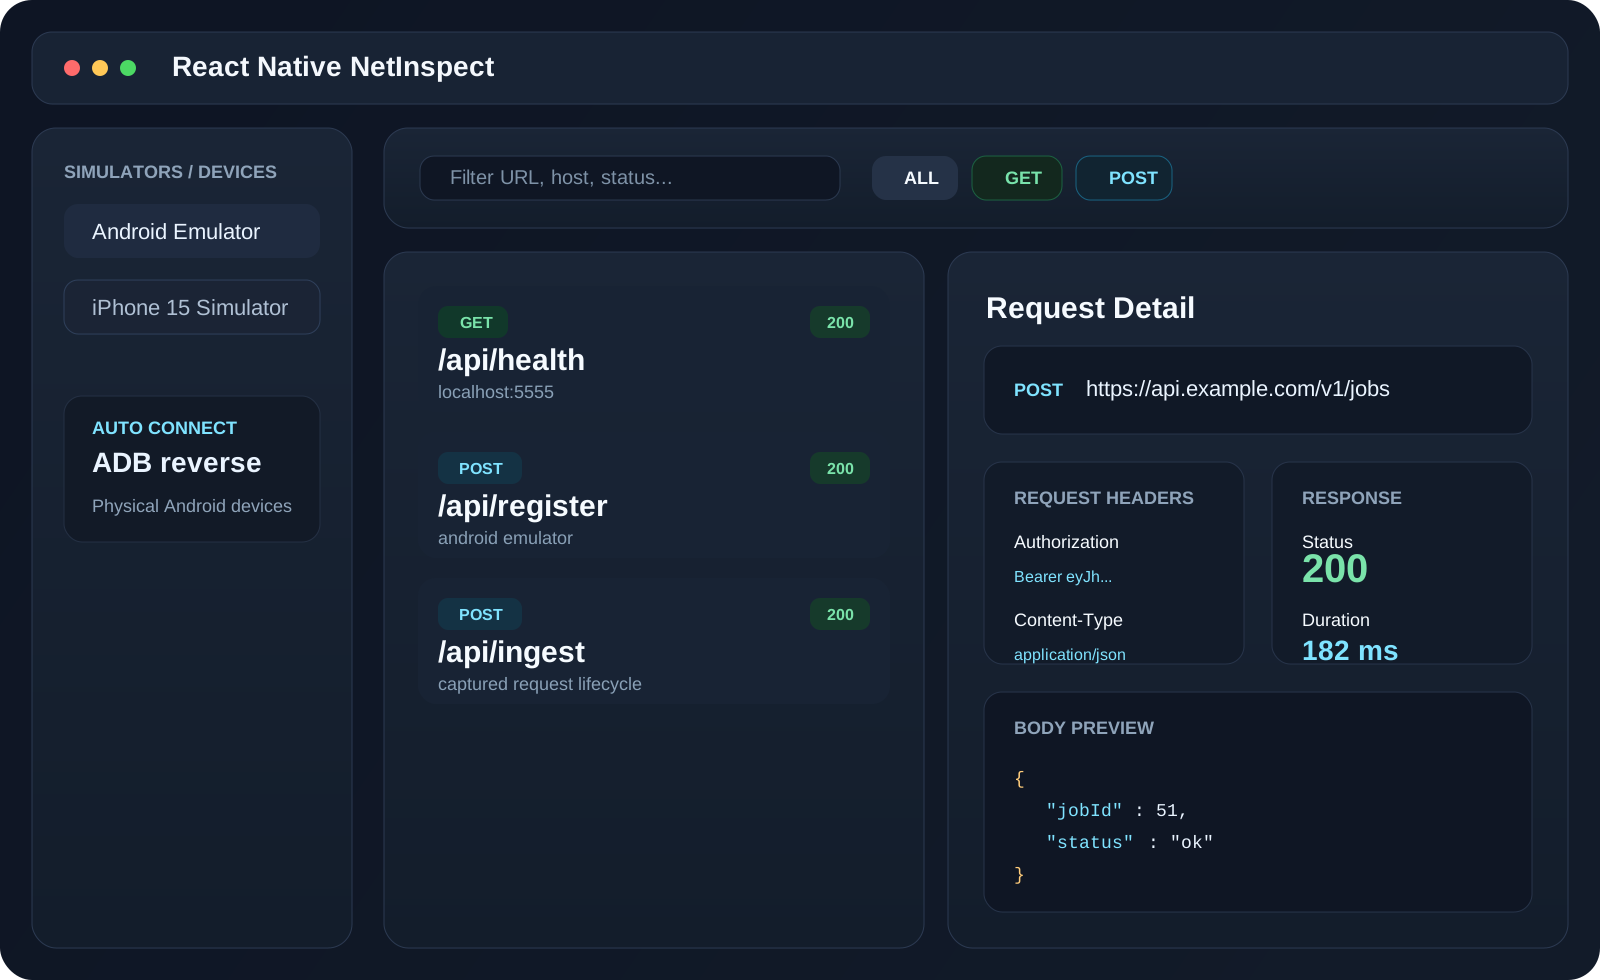
## Preview
## Why This Exists
- See request method, URL, headers, body, status, duration, and response payload in one place.
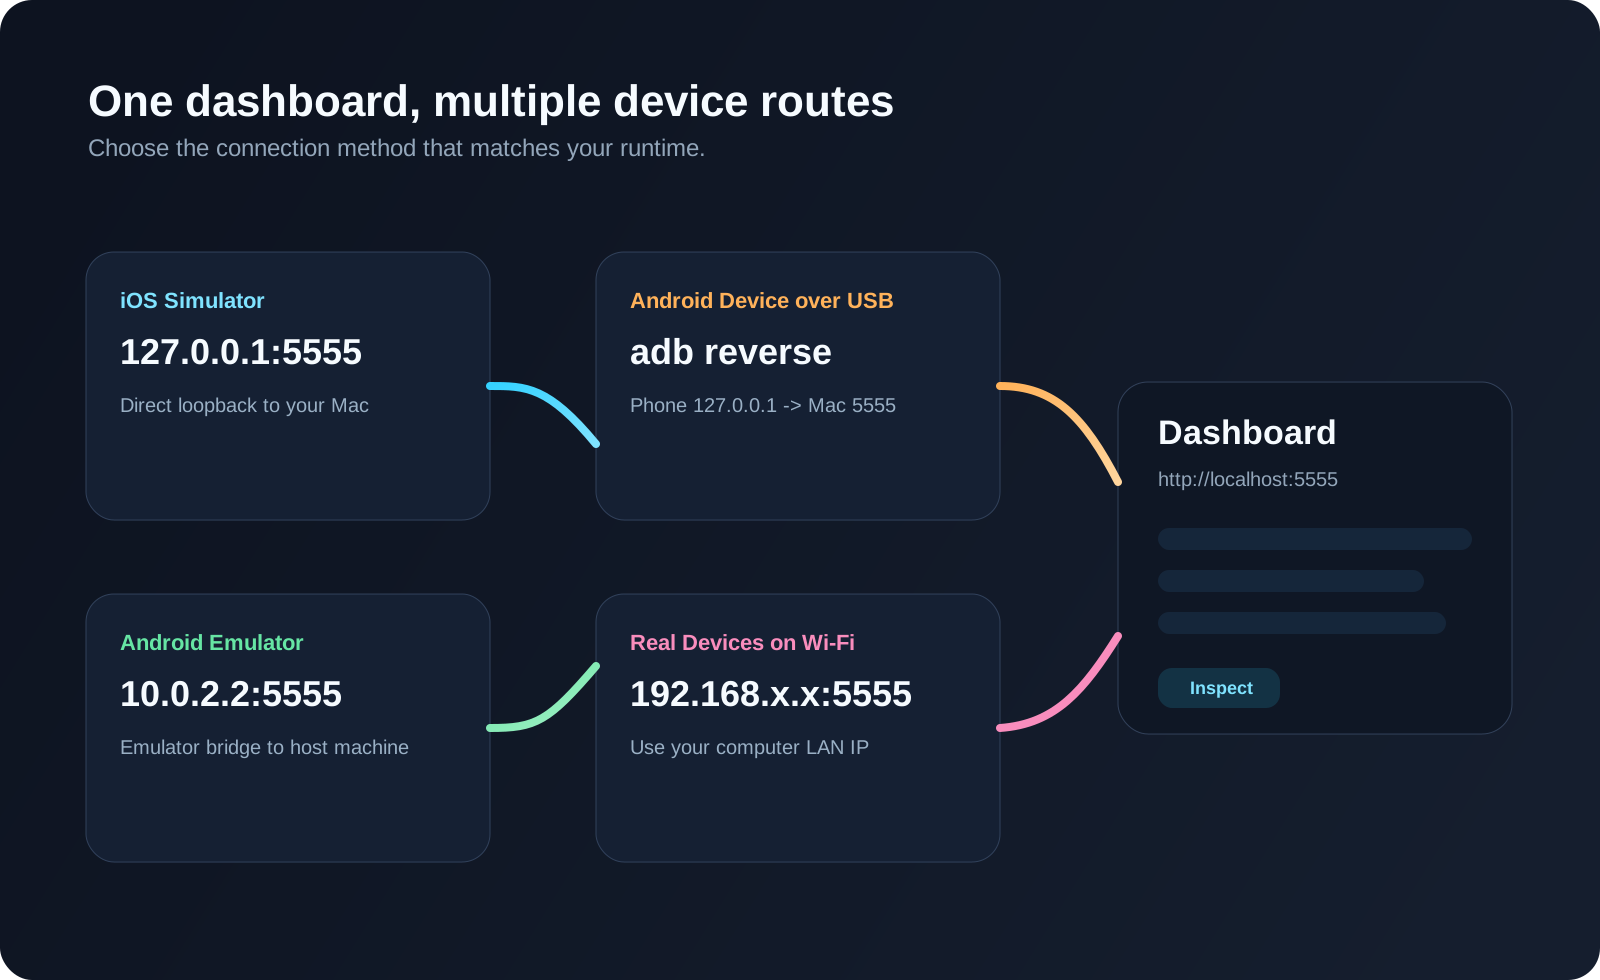
- Works across iOS Simulator, Android Emulator, USB-connected Android devices, and Wi-Fi-connected real devices.
- Supports direct client capture, Android emulator proxy flow, and Android real-device `adb reverse` flow.
- Keeps setup local: run one server on your machine and inspect requests from your app immediately.
## Install
```bash
npm install -D @twinedo/rn-netinspect
```
## Quick Start
This is the simplest setup for both iOS Simulator and Android Emulator.
### 1. Add it once at app startup
Use this in development mode:
```js
if (__DEV__) {
void import("@twinedo/rn-netinspect").then(({ installRNNetInspect }) => {
installRNNetInspect({
appName: "My RN App",
// inspectorUrl: "http://10.0.2.2:19826", // Android emulator reaches the host machine through 10.0.2.2.
});
});
}
```
Why this setup:
- works in stricter ESLint setups without disabling rules
- keeps the library development-only
- usually works for both Simulator and Emulator without extra setup
- if Android Emulator does not connect automatically, uncomment `inspectorUrl`
### 2. Start the server
```bash
npx rn-netinspect-server
```
### 3. Open the dashboard
```txt
http://localhost:19826
```
### 4. Run your app
- iOS: `npm run ios`
- Android: `npm run android`
Then trigger requests in the app and watch them appear in the dashboard.
## If You Need Extra Setup
Most developers should start with the quick start above first.
### Android Emulator
If the Android Emulator does not connect, uncomment this line:
```js
inspectorUrl: "http://10.0.2.2:19826", // Android emulator reaches the host machine through 10.0.2.2.
```
`10.0.2.2` is how the Android Emulator reaches your computer.
### Real Devices
Real devices may need a manual `inspectorUrl`.
- iPhone over Wi-Fi: `http://:19826`
- Android over Wi-Fi: `http://:19826`
- Android over USB: use `adb reverse tcp:19826 tcp:19826`
If you want the server to auto-manage `adb reverse` for physical Android devices, run:
```bash
npx rn-netinspect-server --auto-connect
```
### Android Proxy Warning
Android proxy mode changes global device network settings.
This can affect the whole emulator or phone, not just your app.
Use proxy mode only when you really need it.
To clear old Android proxy settings:
```bash
adb shell settings put global http_proxy :0
adb shell settings put global https_proxy :0
adb shell settings delete global http_proxy
adb shell settings delete global https_proxy
adb shell settings delete global global_http_proxy_host
adb shell settings delete global global_http_proxy_port
adb shell settings delete global global_http_proxy_exclusion_list
```
### If It Still Does Not Connect
If the dashboard opens but no requests appear:
- start the server before launching or reloading the app
- reload the app after the server is already running
- on Android Emulator, uncomment `inspectorUrl: "http://10.0.2.2:19826"`
- on real devices, make sure the device can reach your computer
## Options
```js
installRNNetInspect({
inspectorUrl: "http://127.0.0.1:19826",
appName: "My RN App",
captureBodies: true,
patchFetch: true,
patchXHR: true,
patchConsole: true, // capture console.log/warn/error (default: true)
});
```
## Console Viewer
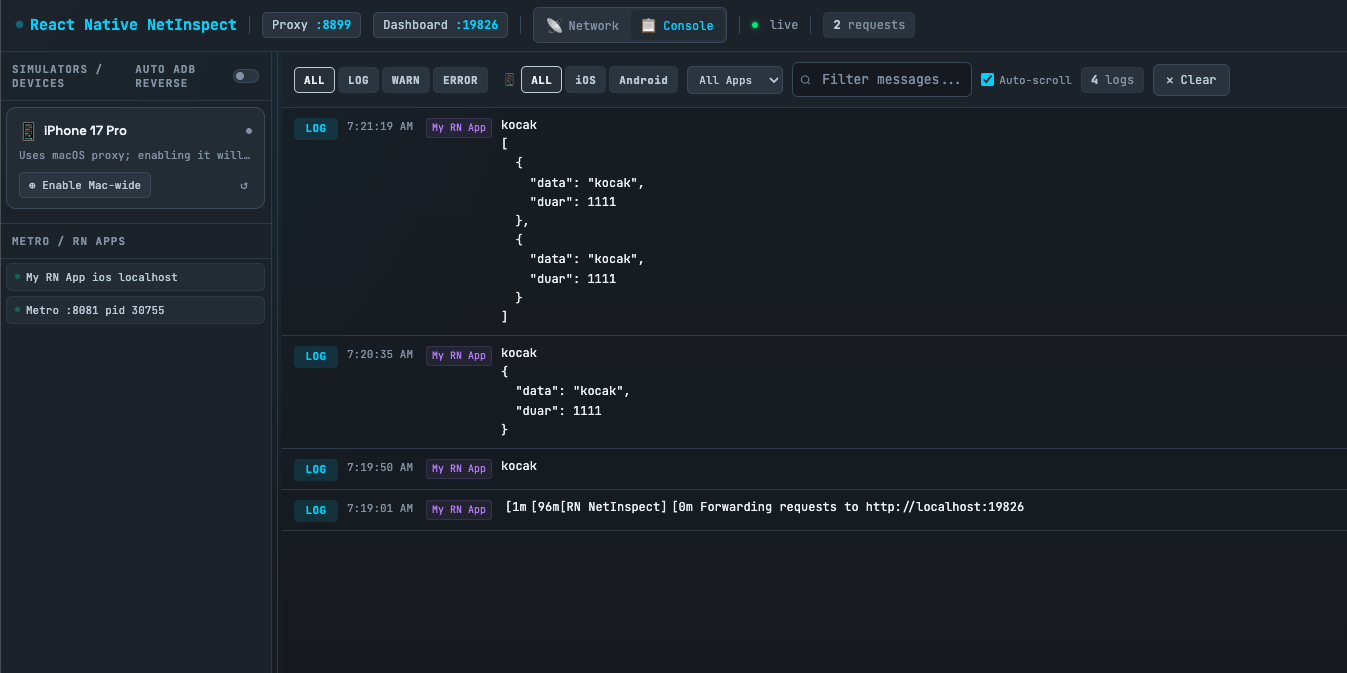
React Native NetInspect can also capture `console.log`, `console.warn`, and `console.error` calls from your app and display them in the dashboard.
### How it works
When enabled (default), the library patches `console.log`, `console.warn`, and `console.error` at the global level. Each call is buffered and sent to the server in batches (every 500ms or when 50 logs accumulate), then broadcast live to the dashboard via WebSocket.
### Using the Console Viewer
1. Open the dashboard at `http://localhost:19826`
2. Click **📋 Console** in the topbar to switch from Network view to Console view
3. Console logs from your app appear in real-time with colored level badges (cyan=log, orange=warn, red=error)
4. Use the filter buttons (ALL / LOG / WARN / ERROR) and search box to find specific messages
5. Click the **📋** copy button on any log entry to copy its text
6. Toggle **Auto-scroll** to follow new logs as they arrive
### Batching
Console logs are batched on the device to reduce HTTP requests:
- Logs are buffered and flushed every **500ms**
- Up to **50 logs** per batch request
- Pending logs are flushed when the inspector is uninstalled
### Disable console capture
```js
installRNNetInspect({
patchConsole: false, // disable console.log/warn/error capture
});
```
## Server API
### Network events
The client sends network events to:
```txt
POST /api/ingest
```
### Console events
Console log entries are sent in batches:
```txt
POST /api/console/ingest
```
Body format (batch):
```json
{
"entries": [
{ "level": "log", "messages": ["Hello", "world"], "timestamp": 1700000000000 },
{ "level": "warn", "messages": ["Warning message"], "timestamp": 1700000001000 }
],
"appName": "My RN App",
"platform": "ios",
"runtimeHost": "localhost",
"installId": "install-..."
}
```
Body format (single entry, backward compatible):
```json
{
"level": "log",
"messages": ["Hello", "world"],
"appName": "My RN App",
"platform": "ios",
"runtimeHost": "localhost"
}
```
The dashboard also uses:
```txt
GET /api/health
POST /api/register
POST /api/console/clear
```
## Troubleshooting
### The dashboard opens, but no requests appear
- make sure the app points to the correct `inspectorUrl`
- reload the app after the server is already running
- on physical devices, verify the phone can open the same URL in its browser
### Android app says it cannot connect to `127.0.0.1:8899`
That is proxy configuration, not the direct client.
- On an emulator, prefer the direct client URL `http://10.0.2.2:19826`
- On a real device, prefer `adb reverse` or a LAN IP
- Clear any old Android global proxy settings if necessary
### Android phone has Wi-Fi but no internet after testing
Clear Android proxy settings:
```bash
adb shell settings put global http_proxy :0
adb shell settings put global https_proxy :0
adb shell settings delete global http_proxy
adb shell settings delete global https_proxy
```
Then check the phone Wi-Fi settings and ensure proxy is disabled.
## Log Colors
React Native NetInspect logs use a colored `[RN NetInspect]` prefix.
To disable colors:
- set `NO_COLOR=1`, or
- set `global.__RN_INSPECTOR_NO_COLOR__ = true` before calling `installRNNetInspect()`