https://github.com/tyh71/covid19
COVID19 Dashboard
https://github.com/tyh71/covid19
johns-hopkins-university pandemic streamlit
Last synced: 9 months ago
JSON representation
COVID19 Dashboard
- Host: GitHub
- URL: https://github.com/tyh71/covid19
- Owner: TYH71
- Created: 2021-03-20T16:42:50.000Z (over 5 years ago)
- Default Branch: main
- Last Pushed: 2021-09-29T05:38:40.000Z (over 4 years ago)
- Last Synced: 2025-02-05T20:03:39.340Z (over 1 year ago)
- Topics: johns-hopkins-university, pandemic, streamlit
- Language: Jupyter Notebook
- Homepage:
- Size: 241 KB
- Stars: 1
- Watchers: 1
- Forks: 0
- Open Issues: 0
-
Metadata Files:
- Readme: README.md
Awesome Lists containing this project
README
# COVID-19 Dashboard
> Web URL : https://share.streamlit.io/tyh71/covid19/main/app.py
This web application aims to deliver interative dashboard with relevant visualisations based on real time COVID-19 Pandemic Data. It was first identified in December 2019 in Wuhan, China. The World Health Organization declared the outbreak a Public Health Emergency of International Concern in January 2020 and a pandemic in March 2020. Data is sourced from Johns Hopkins University CSSE.
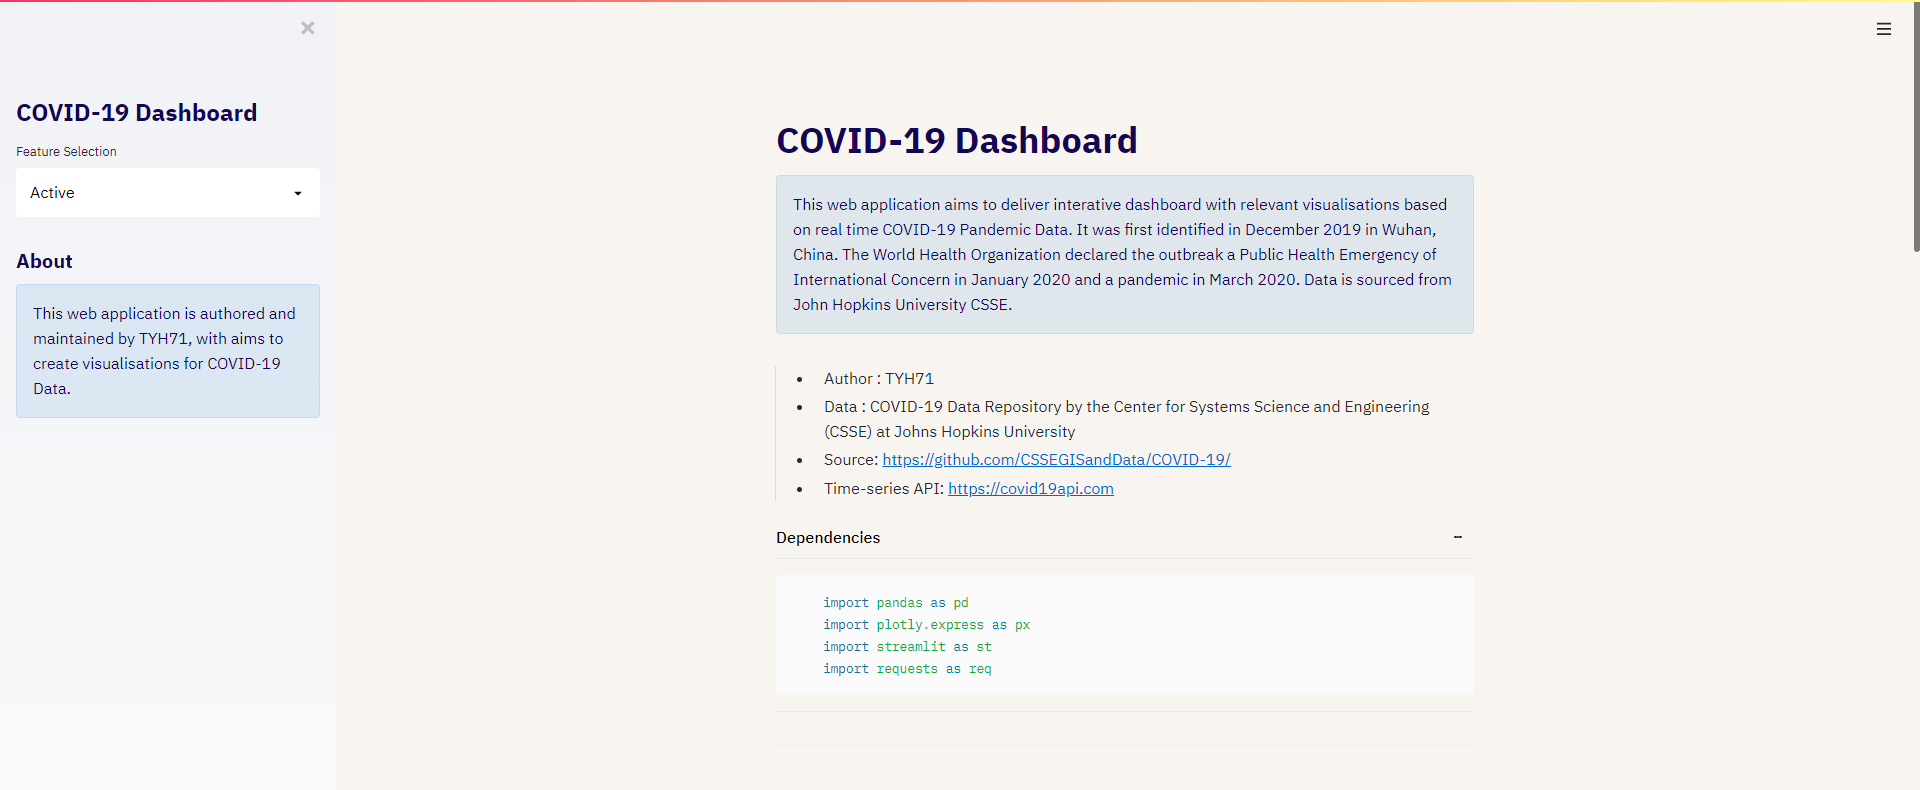
- Author : TYH71
- Data : COVID-19 Data Repository by the Center for Systems Science and Engineering (CSSE) at Johns Hopkins University
- Source: https://github.com/CSSEGISandData/COVID-19/
- Dependencies: streamlit, pandas, plotly
This data set is licensed under the Creative Commons Attribution 4.0 International (CC BY 4.0) by the Johns Hopkins University on behalf of its Center for Systems Science in Engineering.
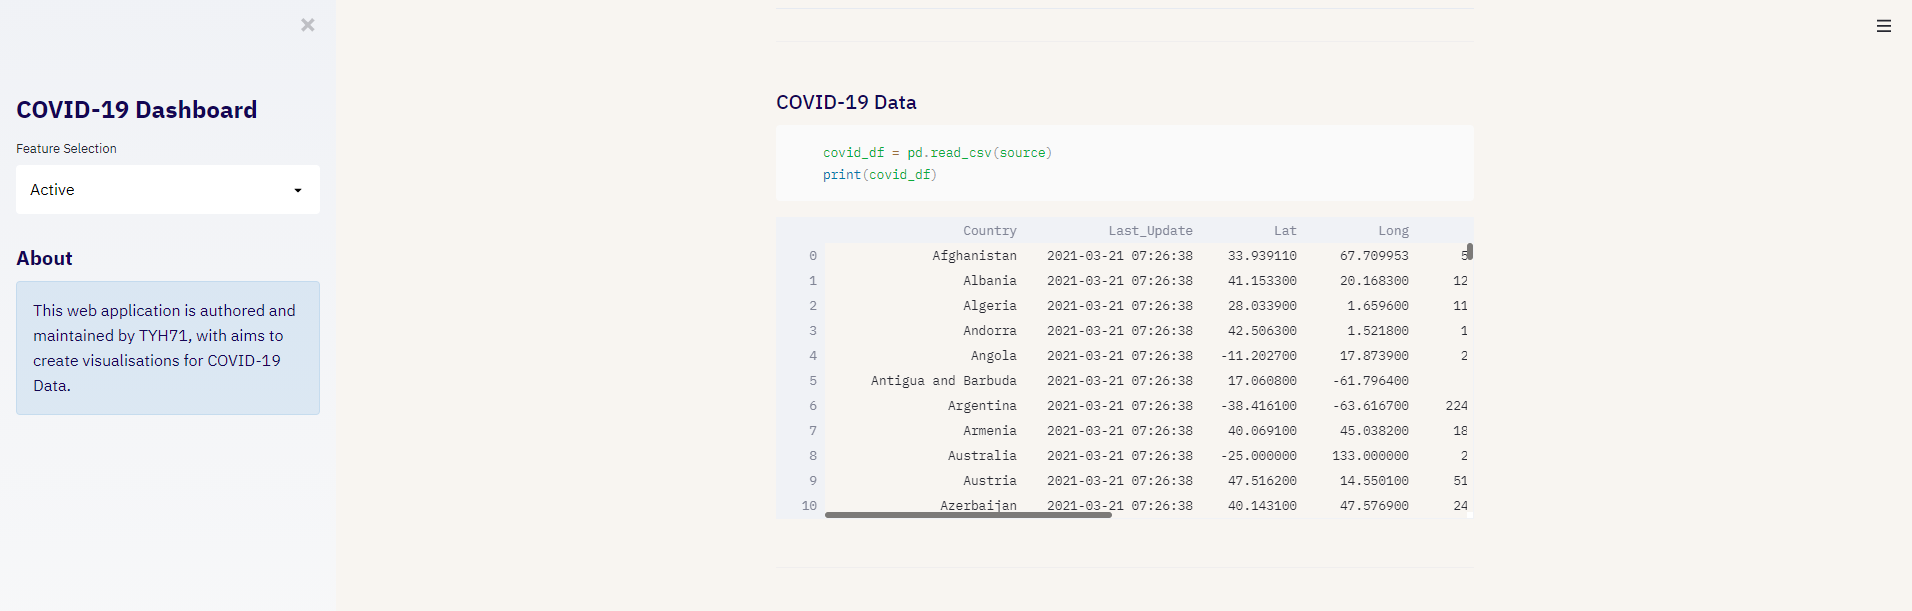
Data URL: https://raw.githubusercontent.com/CSSEGISandData/COVID-19/web-data/data/cases_country.csv
## Running the Web App
Ensure streamlit is being installed in the environment before hand
pip install streamlit --upgrade
Run this command in the console
streamlit run app.py
## Files
- app.py - main web application file deployed using streamlit
- updated.ipynb - jupyter notebook file to show initial numerical and graphical summaries based on live data
- time_series.ipynb - work around time series data
## Visualisations
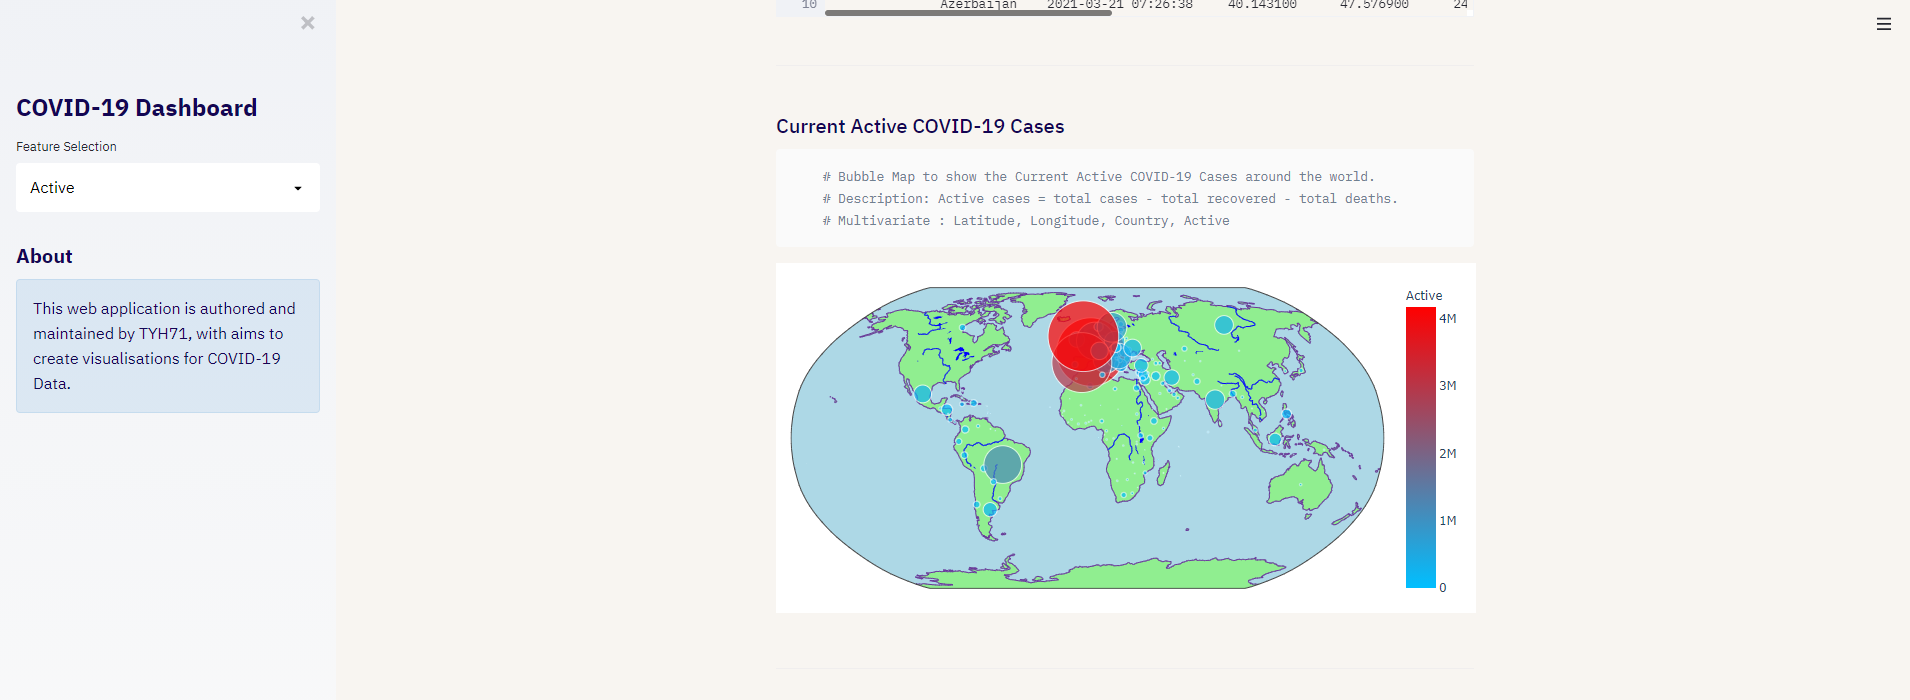
### Scatter Map
Display data points across the map.
Map projection: Robinson
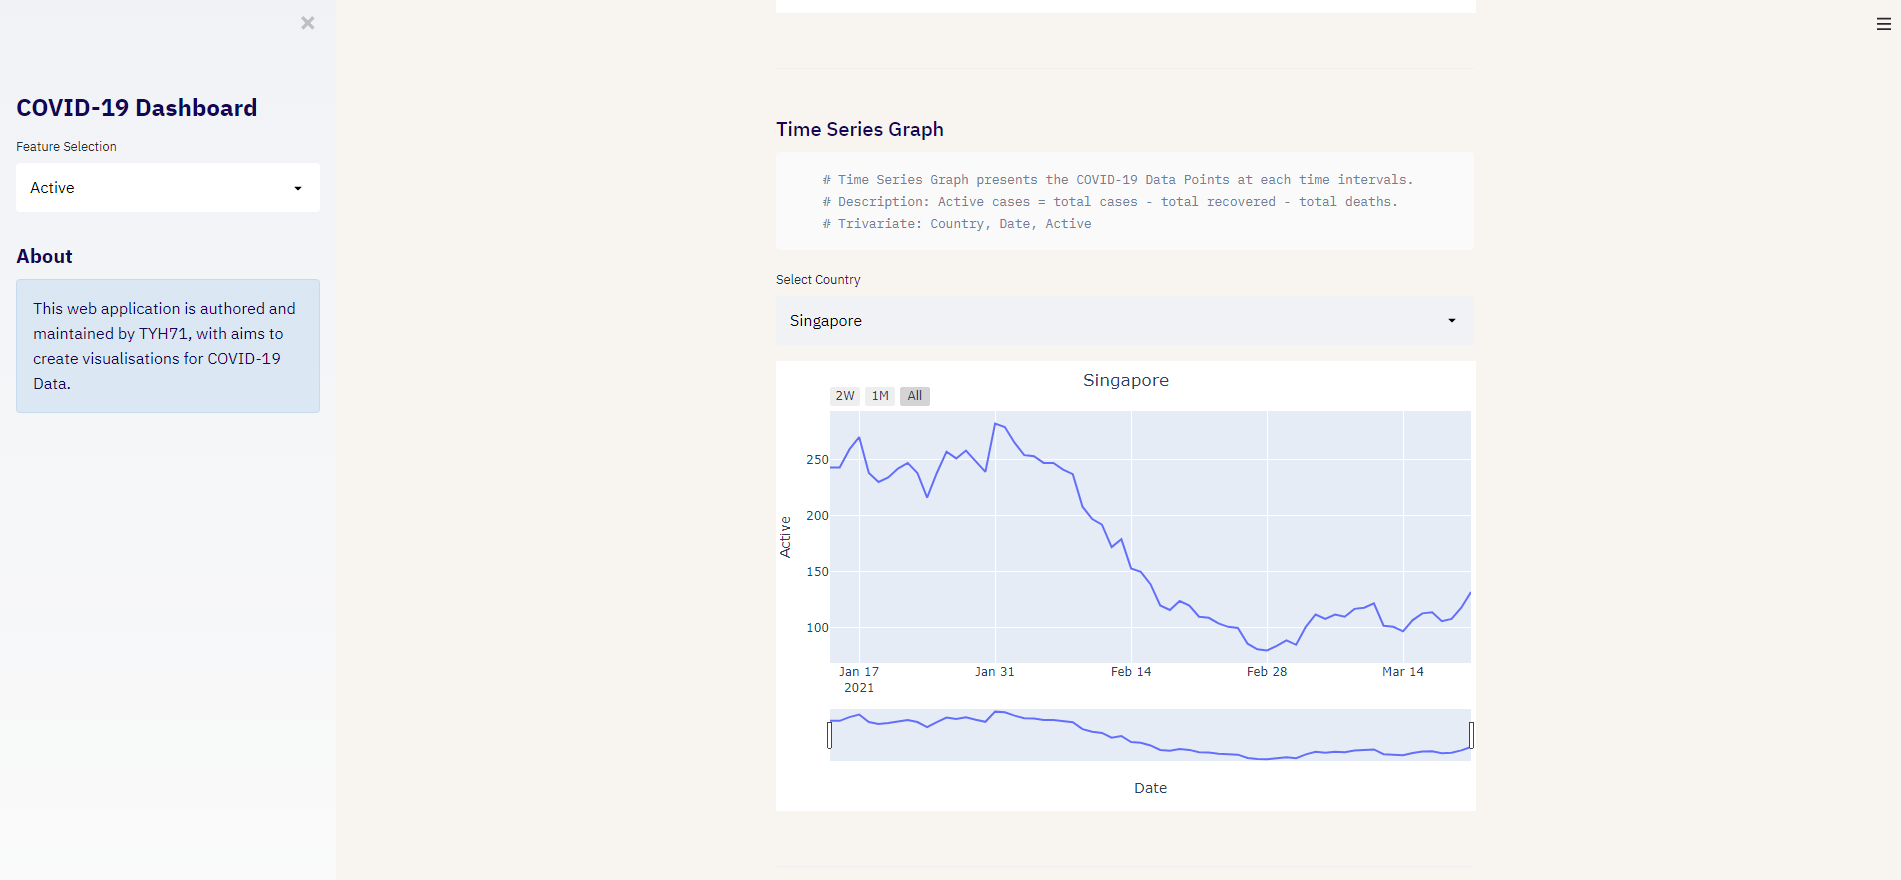
### Time-Series Graph
Features a slider and country selection.
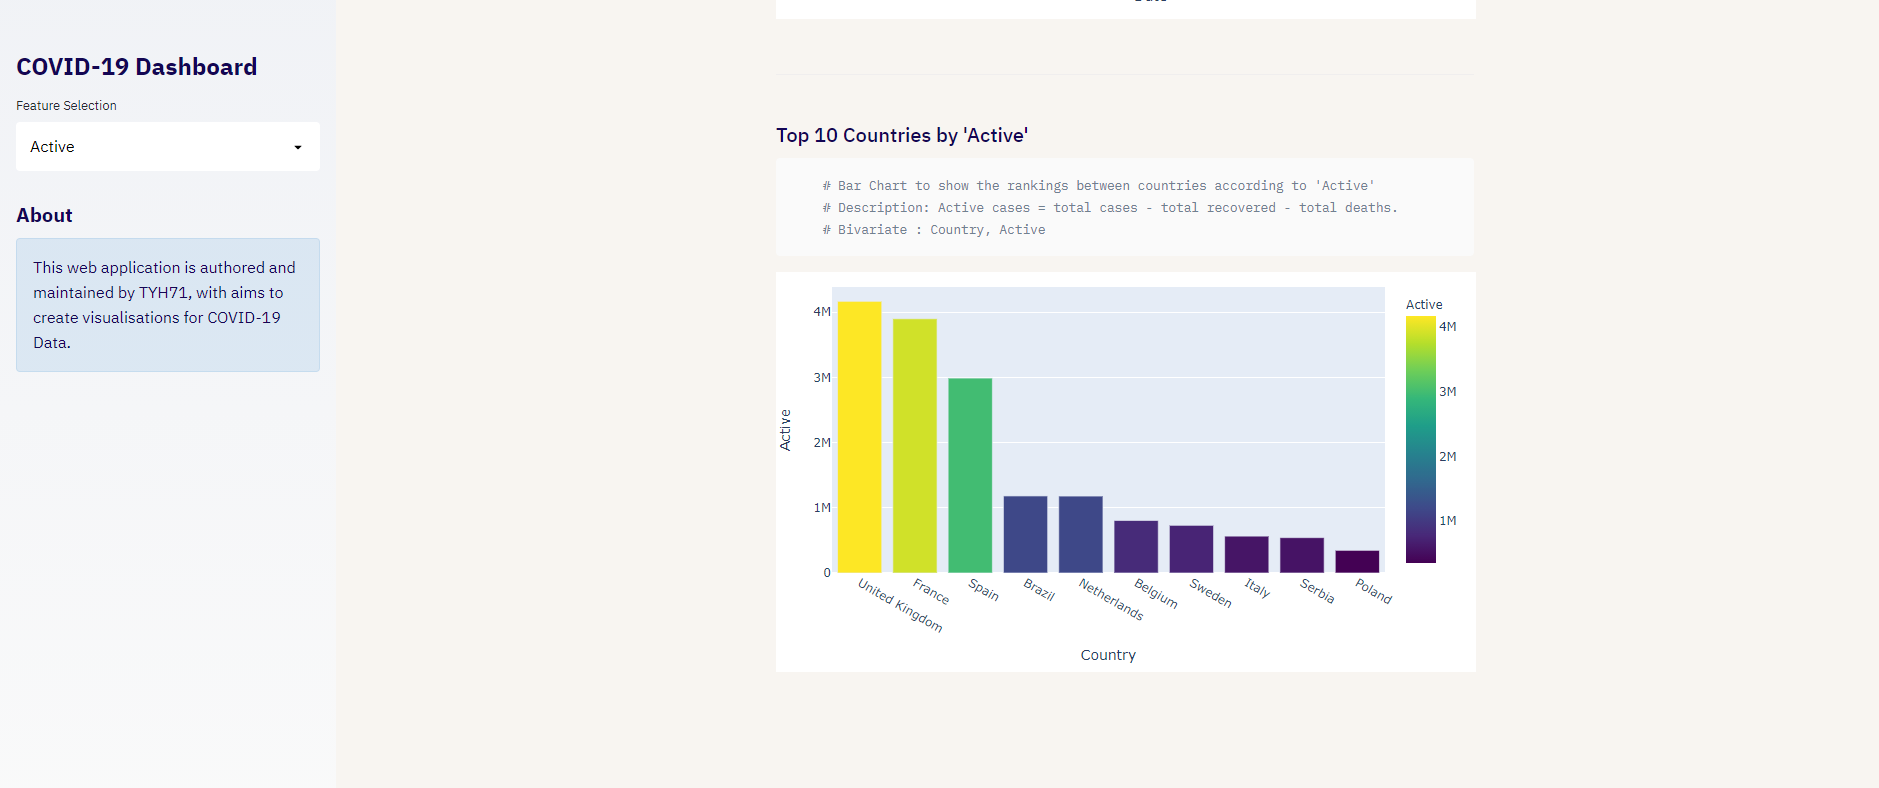
### Ranking Chart
Top 10 countries in terms of ranking