https://github.com/typpo/quickchart-python
Python client for quickchart.io image charts web service
https://github.com/typpo/quickchart-python
chart-api python-charts
Last synced: 3 months ago
JSON representation
Python client for quickchart.io image charts web service
- Host: GitHub
- URL: https://github.com/typpo/quickchart-python
- Owner: typpo
- License: mit
- Created: 2020-05-15T18:35:58.000Z (about 6 years ago)
- Default Branch: master
- Last Pushed: 2023-09-26T20:56:57.000Z (almost 3 years ago)
- Last Synced: 2025-09-25T12:15:17.502Z (9 months ago)
- Topics: chart-api, python-charts
- Language: Python
- Homepage: https://quickchart.io
- Size: 34.2 KB
- Stars: 63
- Watchers: 2
- Forks: 12
- Open Issues: 3
-
Metadata Files:
- Readme: README.md
- License: LICENSE
Awesome Lists containing this project
- jimsghstars - typpo/quickchart-python - Python client for quickchart.io image charts web service (Python)
README
# quickchart-python
[](https://travis-ci.com/typpo/quickchart-python)
[](https://pypi.org/project/quickchart-io/)
[](https://pypi.org/project/quickchart-io/)
A Python client for the [quickchart.io](https://quickchart.io/) image charts web service.
# Installation
Use the `quickchart` library in this project, or install through [pip](https://pypi.org/project/quickchart.io/):
```
pip install quickchart.io
```
As of release 2.0, this package requires >= Python 3.7. If you need support for earlier versions of Python, use [version 1.0.1](https://pypi.org/project/quickchart-io/1.0.1/).
# Usage
This library provides a `QuickChart` class. Import and instantiate it. Then set properties on it and specify a [Chart.js](https://chartjs.org) config:
```python
from quickchart import QuickChart
qc = QuickChart()
qc.width = 500
qc.height = 300
qc.config = {
"type": "bar",
"data": {
"labels": ["Hello world", "Test"],
"datasets": [{
"label": "Foo",
"data": [1, 2]
}]
}
}
```
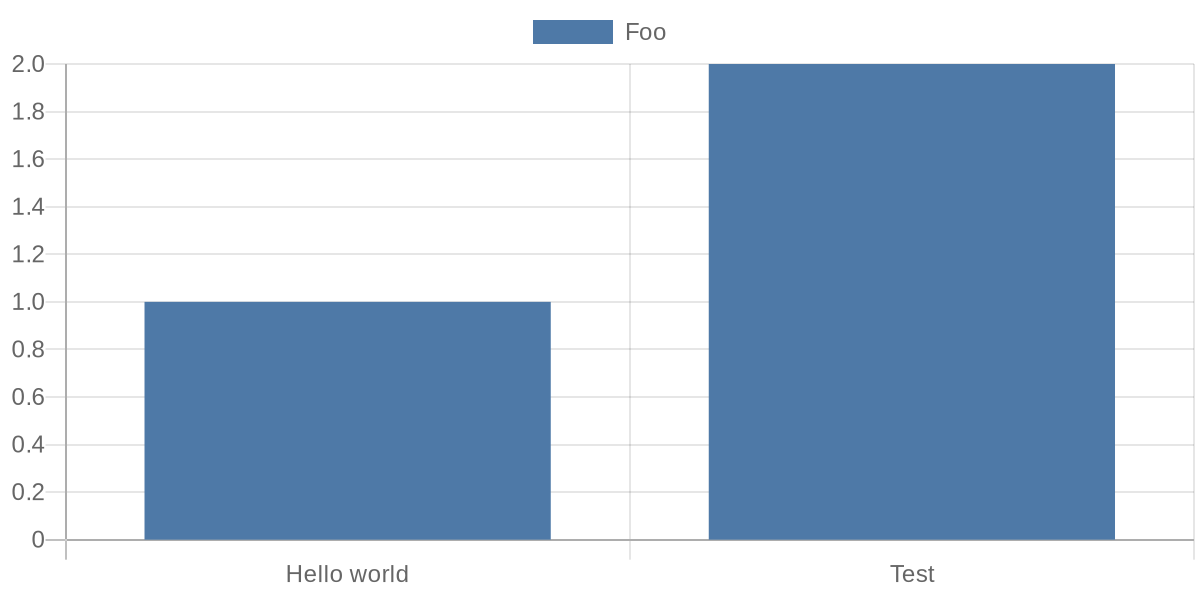
Use `get_url()` on your quickchart object to get the encoded URL that renders your chart:
```python
print(qc.get_url())
# https://quickchart.io/chart?c=%7B%22chart%22%3A+%7B%22type%22%3A+%22bar%22%2C+%22data%22%3A+%7B%22labels%22%3A+%5B%22Hello+world%22%2C+%22Test%22%5D%2C+%22datasets%22%3A+%5B%7B%22label%22%3A+%22Foo%22%2C+%22data%22%3A+%5B1%2C+2%5D%7D%5D%7D%7D%7D&w=600&h=300&bkg=%23ffffff&devicePixelRatio=2.0&f=png
```
If you have a long or complicated chart, use `get_short_url()` to get a fixed-length URL using the quickchart.io web service (note that these URLs only persist for a short time unless you have a subscription):
```python
print(qc.get_short_url())
# https://quickchart.io/chart/render/f-a1d3e804-dfea-442c-88b0-9801b9808401
```
The URLs will render an image of a chart:
# Using Javascript functions in your chart
Chart.js sometimes relies on Javascript functions (e.g. for formatting tick labels). There are a couple approaches:
- Build chart configuration as a string instead of a Python object. See `examples/simple_example_with_function.py`.
- Build chart configuration as a Python object and include a placeholder string for the Javascript function. Then, find and replace it.
- Use the provided `QuickChartFunction` class. See `examples/using_quickchartfunction.py` for a full example.
A short example using `QuickChartFunction`:
```py
qc = QuickChart()
qc.config = {
"type": "bar",
"data": {
"labels": ["A", "B"],
"datasets": [{
"label": "Foo",
"data": [1, 2]
}]
},
"options": {
"scales": {
"yAxes": [{
"ticks": {
"callback": QuickChartFunction('(val) => val + "k"')
}
}],
"xAxes": [{
"ticks": {
"callback": QuickChartFunction('''function(val) {
return val + '???';
}''')
}
}]
}
}
}
print(qc.get_url())
```
# Customizing your chart
You can set the following properties:
### config: dict or str
The actual Chart.js chart configuration.
If your chart configuration is JSON-compatible, it's usually easiest to pass an object ([example](https://github.com/typpo/quickchart-python/blob/master/examples/simple_example.py)). If your chart configuration contains a Javascript function, you may pass it as a string ([example](https://github.com/typpo/quickchart-python/blob/master/examples/simple_example_with_function.py)) or use `QuickChartFunction` ([example](https://github.com/typpo/quickchart-python/blob/master/examples/using_quickchartfunction.py)).
### width: int
Width of the chart image in pixels. Defaults to 500
### height: int
Height of the chart image in pixels. Defaults to 300
### format: str
Format of the chart. Defaults to png. svg is also valid.
### background_color: str
The background color of the chart. Any valid HTML color works. Defaults to #ffffff (white). Also takes rgb, rgba, and hsl values.
### device_pixel_ratio: float
The device pixel ratio of the chart. This will multiply the number of pixels by the value. This is usually used for retina displays. Defaults to 1.0.
### version: str
The version of Chart.js to use. Acceptable values are documented [here](https://quickchart.io/documentation/#parameters). Usually used to select Chart.js 3+.
### scheme: str
The protocol to use. Defaults to `https`.
### host: str
Override the host of the chart render server. Defaults to quickchart.io.
### key: str
Set an API key that will be included with the request.
## Getting URLs
There are two ways to get a URL for your chart object.
### get_url(): str
Returns a URL that will display the chart image when loaded.
### get_short_url(): str
Uses the quickchart.io web service to create a fixed-length chart URL that displays the chart image. Returns a URL such as `https://quickchart.io/chart/render/f-a1d3e804-dfea-442c-88b0-9801b9808401`.
Note that short URLs expire after a few days for users of the free service. You can [subscribe](https://quickchart.io/pricing/) to keep them around longer.
## Other functionality
### get_bytes()
Returns the bytes representing the chart image.
### to_file(path: str)
Writes the chart image to a file path.
## More examples
Checkout the `examples` directory to see other usage.