https://github.com/unicolab/holysheet
HolySheet is a Python package that generates beautiful, self-contained, interactive HTML dashboards powered by React — without requiring the end user to install Node.js, npm, or any frontend tooling.
https://github.com/unicolab/holysheet
Last synced: 21 days ago
JSON representation
HolySheet is a Python package that generates beautiful, self-contained, interactive HTML dashboards powered by React — without requiring the end user to install Node.js, npm, or any frontend tooling.
- Host: GitHub
- URL: https://github.com/unicolab/holysheet
- Owner: UnicoLab
- License: mit
- Created: 2026-05-21T08:04:03.000Z (about 1 month ago)
- Default Branch: main
- Last Pushed: 2026-05-21T15:14:12.000Z (about 1 month ago)
- Last Synced: 2026-05-21T23:07:34.423Z (about 1 month ago)
- Language: TypeScript
- Size: 3.4 MB
- Stars: 0
- Watchers: 0
- Forks: 0
- Open Issues: 0
-
Metadata Files:
- Readme: README.md
- Changelog: CHANGELOG.md
- License: LICENSE
Awesome Lists containing this project
README

📊 HolySheet
Python-first report compiler that turns raw data into stunning,
interactive React dashboards — zero frontend knowledge required.


📖 Documentation •
Screenshots •
Quickstart •
Installation •
Block Reference •
Examples •
Architecture •
Development
---
## 📸 See It In Action
> **Don't take our word for it — see what HolySheet generates:**
🌙 Dark Theme
☀️ Light Theme
👔 Executive Theme
All dashboards above are generated from Python code — zero frontend knowledge required.
Each is a single, self-contained HTML file that opens in any browser.
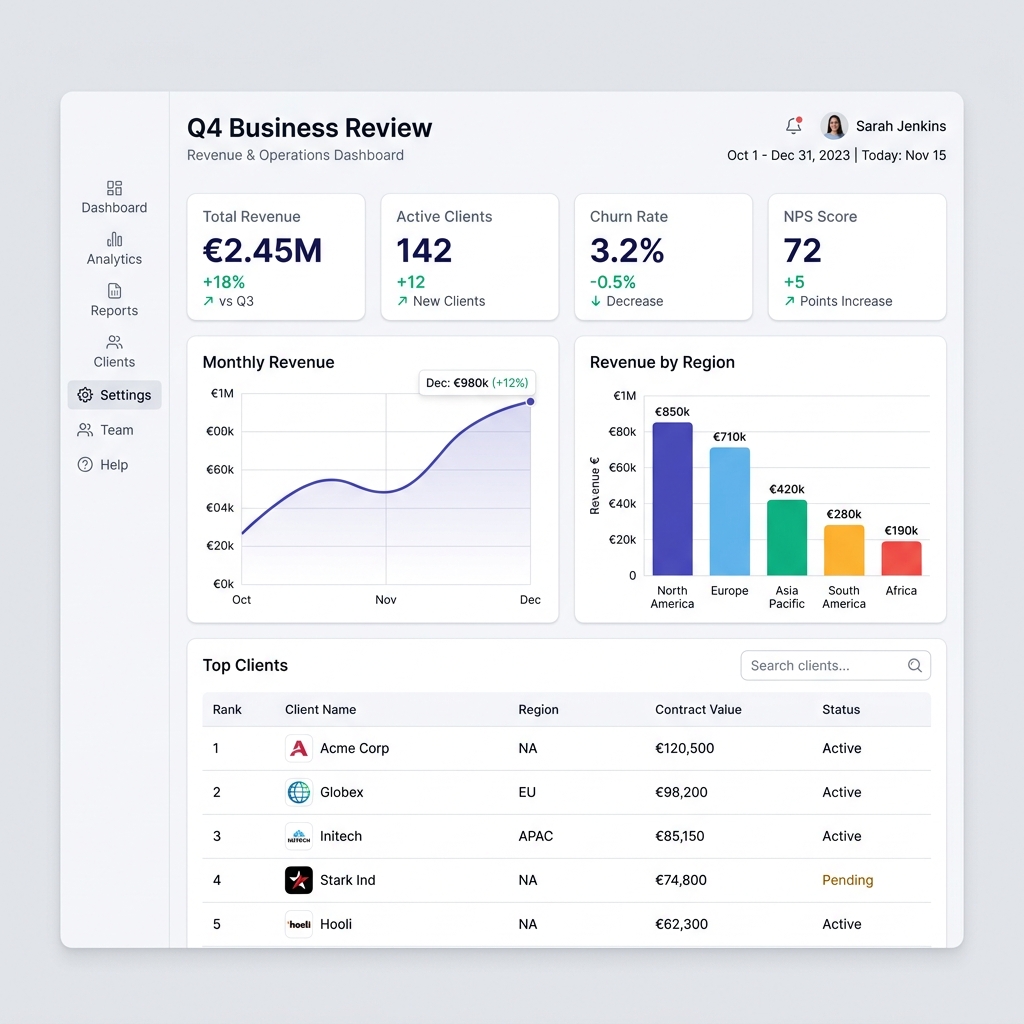
📊 Basic Report
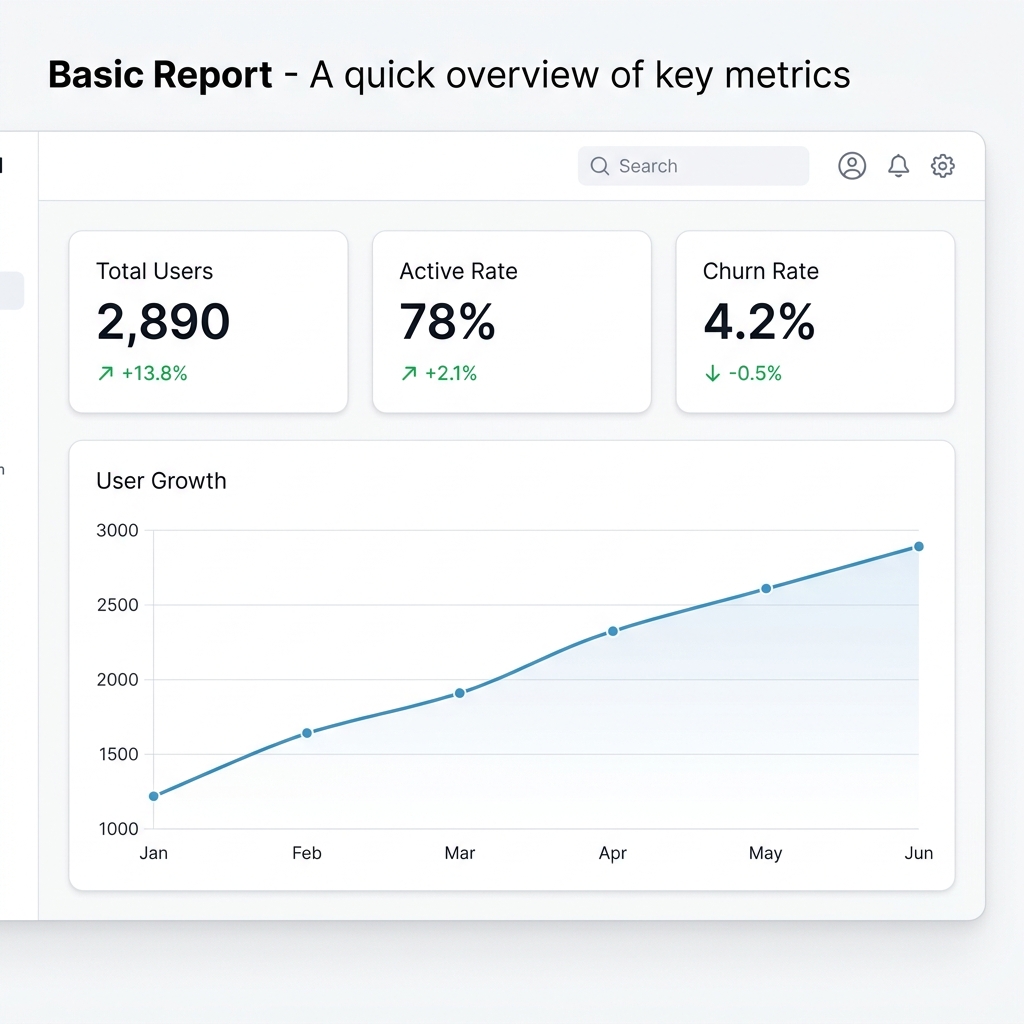
KPI cards + line chart · Light theme
💼 Sales Analytics
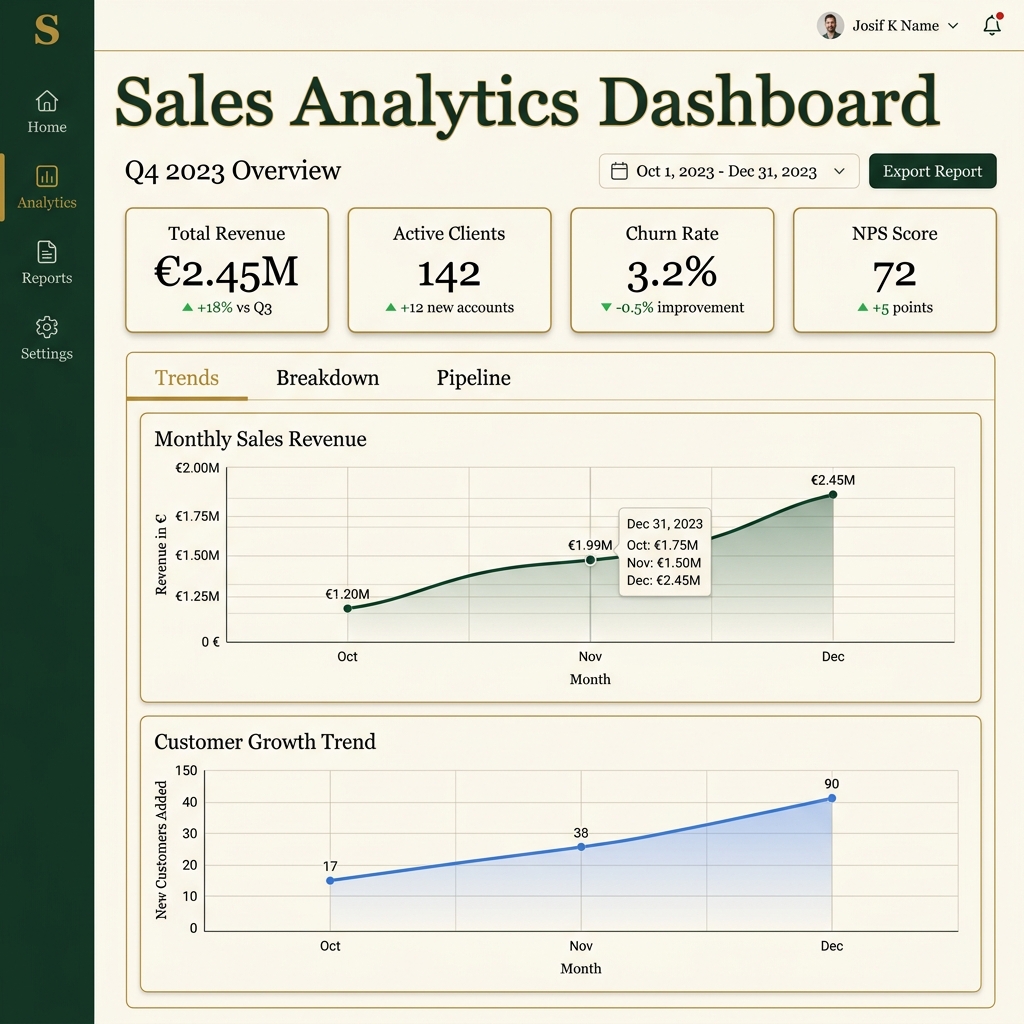
Tabbed charts + KPIs · Executive theme
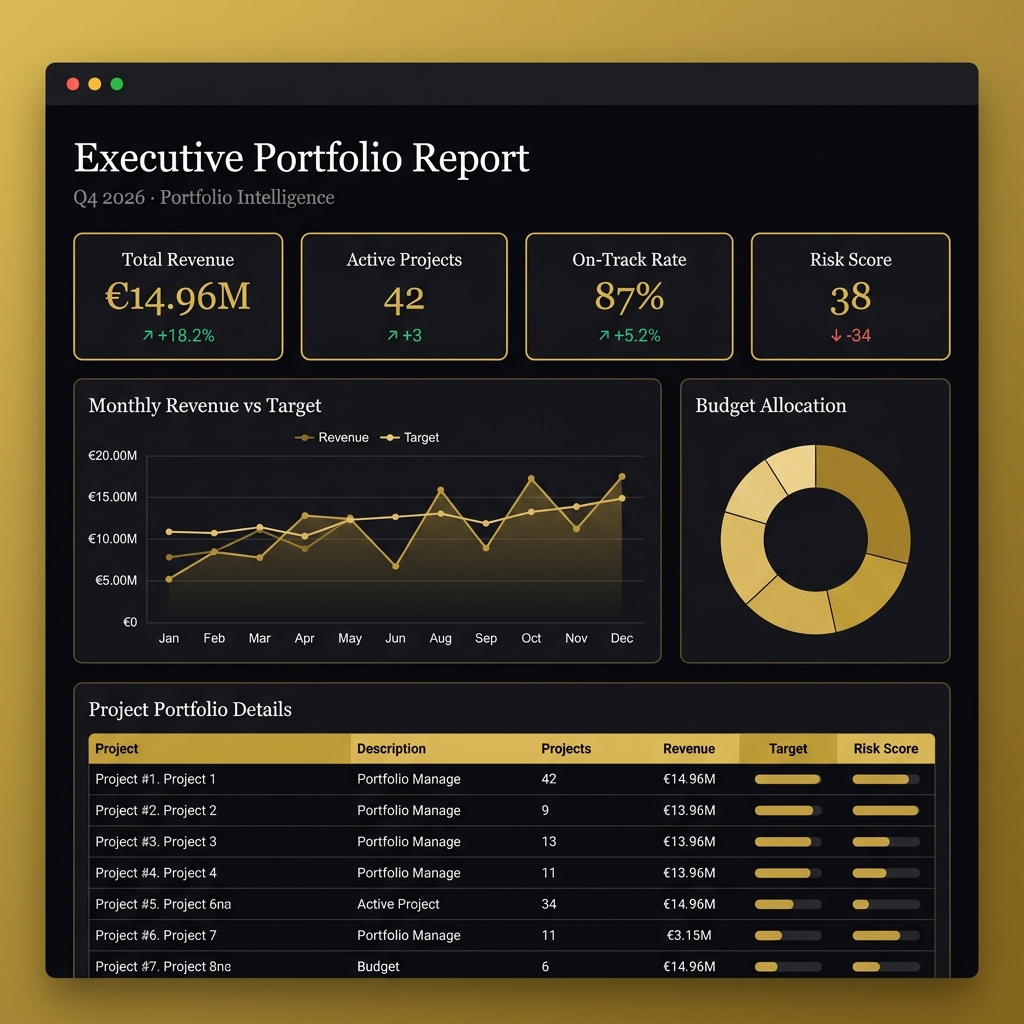
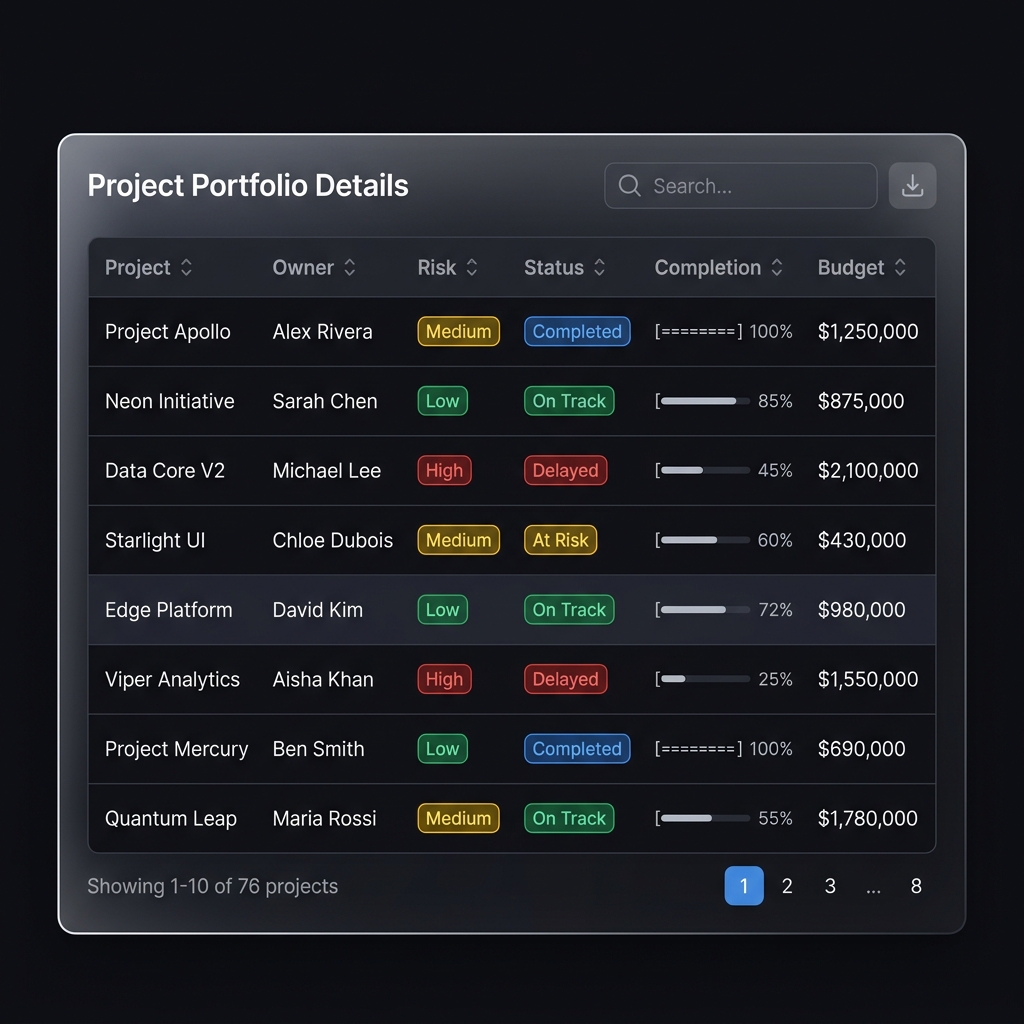
🏢 Portfolio Report
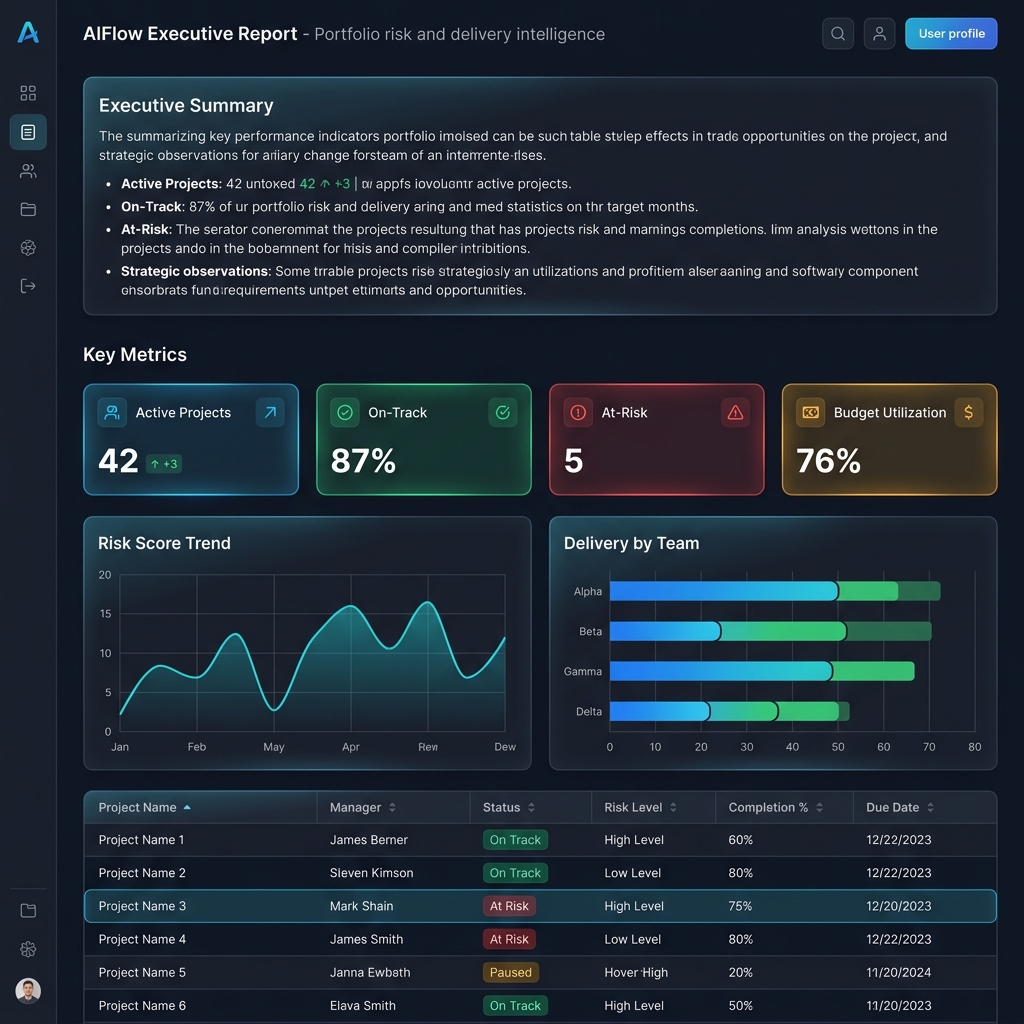
Columns layout + data table · Dark theme
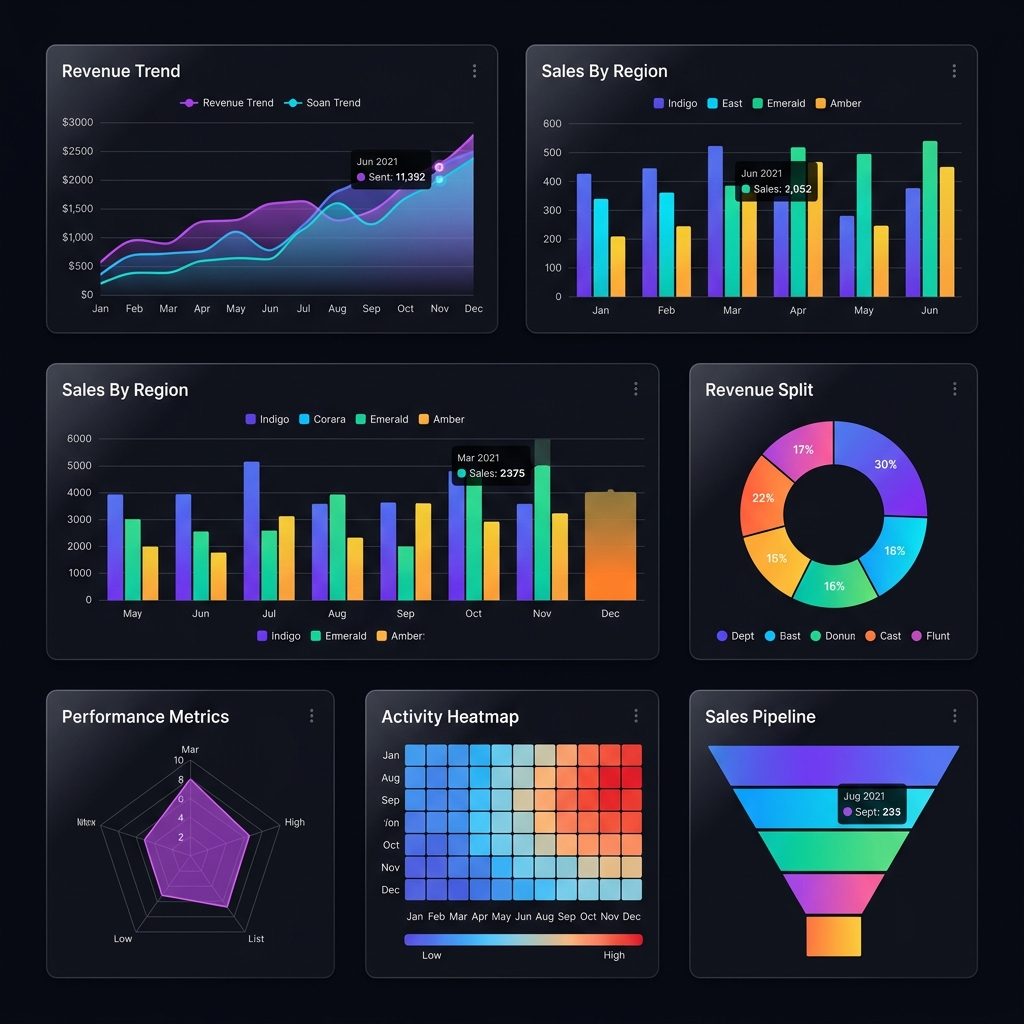
🚀 Full Showcase
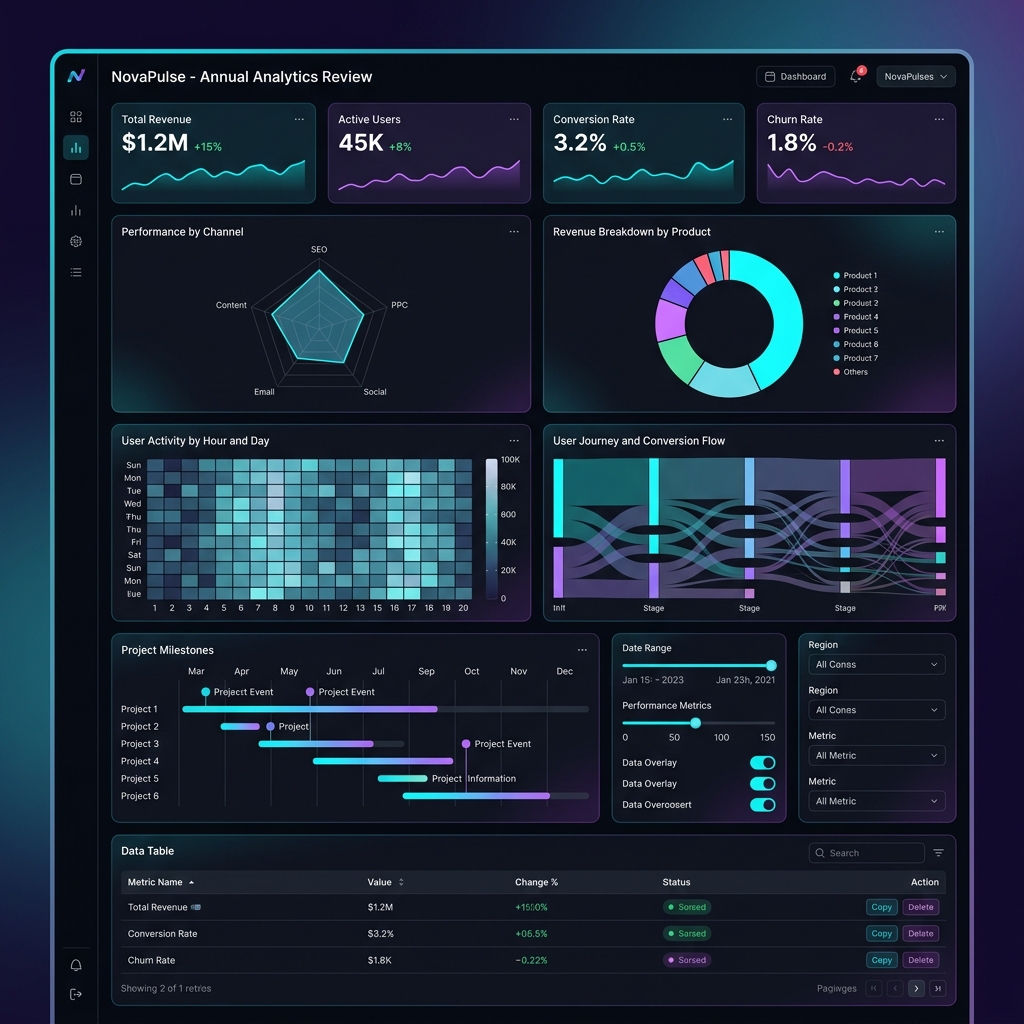
37 blocks, all chart types · Dark theme
---
## ✨ What is HolySheet?
**HolySheet** generates stunning, self-contained, interactive HTML dashboards powered by **React** + **Apache ECharts** — without requiring Node.js, npm, or any frontend tooling.
> *Write your dashboard in Python. Get a gorgeous interactive report as a single HTML file.*
> *No server. No dependencies. Just open it in a browser. Holy Sheet, that's easy!*
### ⚡ Key Highlights
- 🧱 **57 block types** — 18 charts, 6 metrics, 14 content/data, 8 layout, 9 interactive, AI insights + SQL
- 🎨 **3 premium themes** — Dark, Light, and Executive with full design systems
- 📦 **Single-file export** — One `.html` file (~1.5 MB) with everything embedded
- 🐼 **Any data source** — Pandas, Polars, dicts, lists, Google Sheets
- 🤖 **AI-powered insights** — OpenAI, Anthropic, Google Gemini integration
- 🔐 **Enterprise features** — Password protection, expiring reports, PDF export
- 🔧 **Developer tools** — CLI, hot-reload dev server, linting, report diff
- 📱 **Responsive & PWA** — Works on mobile, supports offline mode
```python
from holysheet import Report, KPI, LineChart, DataTable
report = Report(title="Executive Portfolio Report", theme="dark")
report.add(KPI(label="Revenue", value=1_250_000, unit="€", delta="+12%", status="positive"))
report.add(LineChart(title="Revenue Trend", data=revenue_df, x="date", y="revenue"))
report.add(DataTable(title="Projects", data=projects_df))
report.export_html("report.html") # ← That's it. Open in any browser.
```
---
## 🙏 Why HolySheet?
| 😩 The Problem | 😇 The HolySheet Way |
|---|---|
| Dashboards require complex frontend setup | **Zero** frontend knowledge needed |
| Reports need a running server | Self-contained HTML files — open anywhere |
| Visualization libraries produce basic charts | Enterprise-grade React UI with interactive ECharts |
| Sharing reports is painful | Single HTML file — email it, Slack it, embed it |
| Python-to-dashboard tools look dated | Modern Material UI design with dark/light/executive themes |
| Data wrangling across libraries | Native **Pandas**, **Polars**, dict, and list support |
---
## 🚀 Quickstart
### 1. Install
```bash
pip install holysheet
```
### 2. Build a dashboard
```python
from holysheet import Report, KPI, LineChart, BarChart, PieChart, DataTable, Section
report = Report(
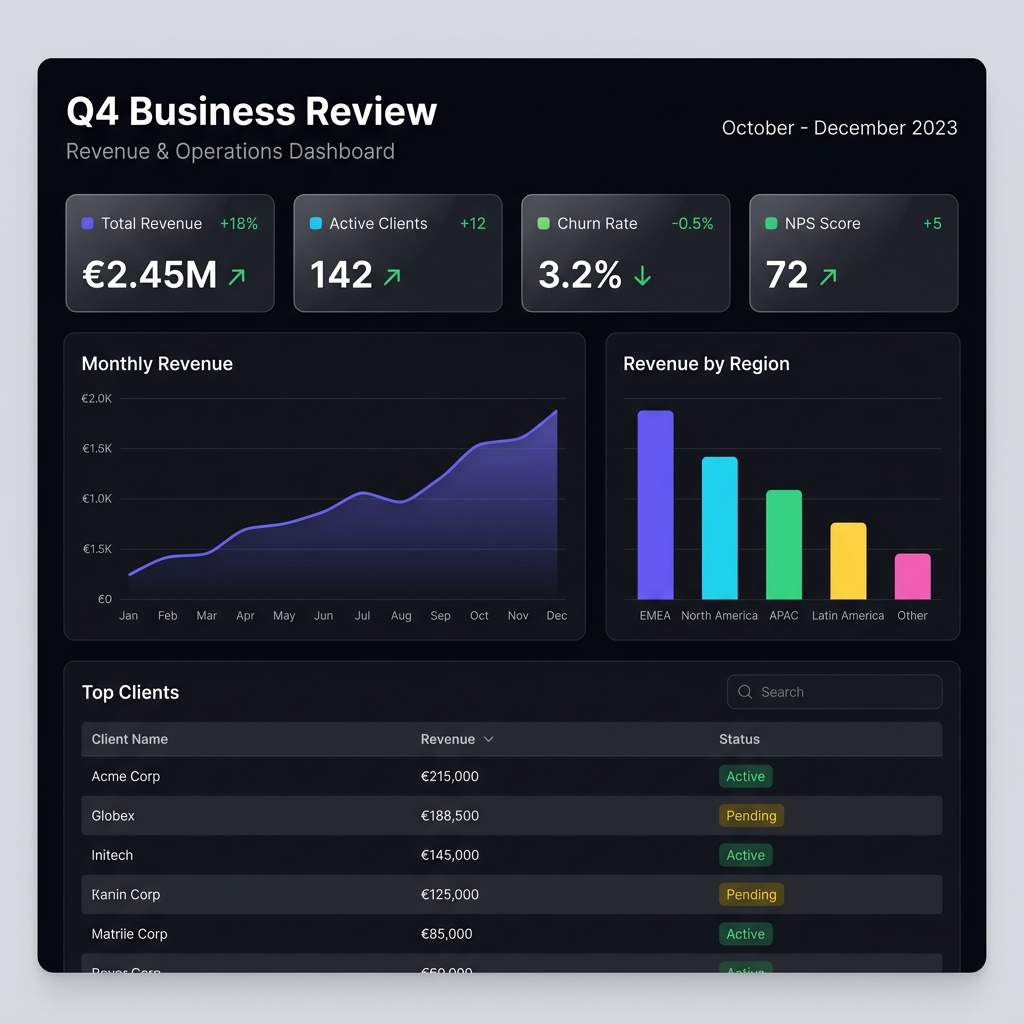
title="Q4 Business Review",
subtitle="Revenue & Operations Dashboard",
theme="dark",
author="Data Team",
)
# KPI cards — they auto-arrange in a responsive grid
report.add(KPI(label="Total Revenue", value=2_450_000, unit="€", delta="+18%", status="positive"))
report.add(KPI(label="Active Clients", value=142, delta="+12", status="positive"))
report.add(KPI(label="Churn Rate", value=3.2, unit="%", delta="-0.5%", status="positive"))
report.add(KPI(label="NPS Score", value=72, delta="+5", status="positive"))
# Charts — pass any DataFrame or list of dicts
report.add(LineChart(title="Monthly Revenue", data=revenue_data, x="month", y="revenue"))
report.add(BarChart(title="Revenue by Region", data=region_data, x="region", y="revenue"))
report.add(PieChart(title="Revenue Split", data=split_data, name="category", value="amount"))
# Searchable, paginated data table
report.add(DataTable(title="Top Clients", data=clients_data, columns=["name", "revenue", "status"]))
# Export → a single portable HTML file
report.export_html("q4_review.html")
```
### 3. Open & share
```bash
open q4_review.html # macOS
xdg-open q4_review.html # Linux
start q4_review.html # Windows
```
The HTML file is fully standalone — no server, no internet, no Node.js. Send it via email, upload to S3, embed in Confluence — it just works.
---
## 📦 Installation
```bash
# Core (zero extras)
pip install holysheet
# With Pandas support
pip install holysheet[pandas]
# With PDF export
pip install holysheet[pdf]
# With AI insights (OpenAI / Anthropic / Google)
pip install holysheet[ai]
# With cloud publishing (S3 / GCS)
pip install holysheet[cloud]
# With Google Sheets data source
pip install holysheet[gsheets]
# Everything
pip install holysheet[all]
```
**Requirements:**
- 🐍 Python **3.11+**
- 🚫 No Node.js required
- 🚫 No frontend build step
- 🚫 No running server
**Core dependencies:** `pydantic v2` · `jinja2` · `orjson` · `loguru` · `click`
---
## 🧱 Block Reference
HolySheet ships with **57 block types** organized into seven categories.
🖼️ Block Preview — Charts & Data Tables
18 chart types: line, bar, pie, radar, heatmap, funnel, and more
Interactive tables with search, sort, pagination & conditional formatting
🖼️ Block Preview — KPI Cards Across Themes
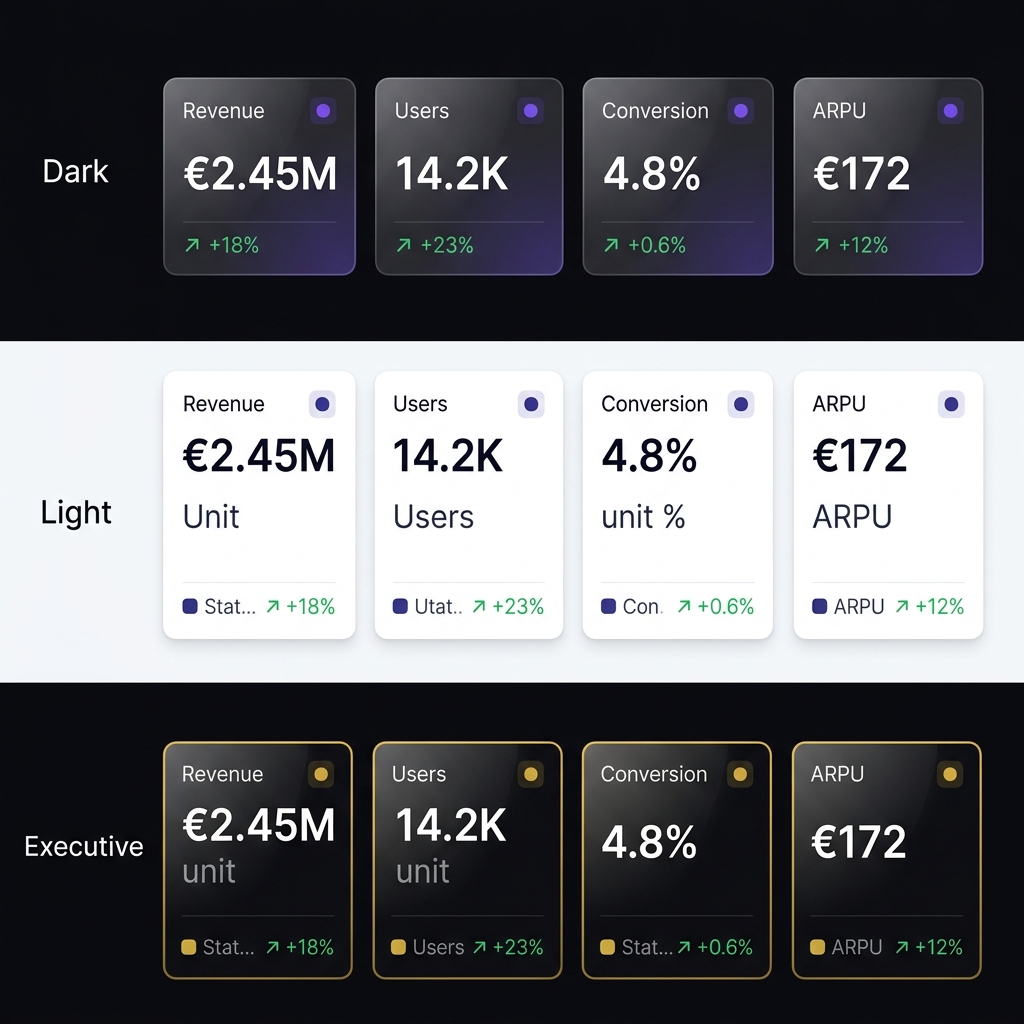
KPI cards automatically adapt to your chosen theme
### 📊 Charts (18)
| Block | Description | Key Props |
|---|---|---|
| `LineChart` | Multi-series line chart | `data`, `x`, `y`, `series`, `annotations` |
| `AreaChart` | Filled area chart | `data`, `x`, `y`, `series`, `annotations` |
| `BarChart` | Grouped/stacked bar chart | `data`, `x`, `y`, `series`, `annotations` |
| `PieChart` | Pie / donut chart | `data`, `name`, `value` |
| `ScatterChart` | Scatter / bubble plot | `data`, `x`, `y`, `size`, `category` |
| `RadarChart` | Radar / spider chart | `data`, `indicators` |
| `GaugeChart` | Speedometer gauge | `value`, `min`, `max`, `thresholds` |
| `FunnelChart` | Conversion funnel | `data`, `name`, `value` |
| `TreemapChart` | Hierarchical treemap | `data`, `name`, `value`, `category` |
| `HeatmapChart` | 2D heatmap with color gradient | `data`, `x`, `y`, `value` |
| `CandlestickChart` | Financial OHLC chart | `data`, `x`, `open`, `close`, `low`, `high` |
| `SankeyChart` | Flow / energy diagram | `nodes`, `links` |
| `WaterfallChart` | Waterfall / bridge chart | `data`, `category`, `value` |
| `BoxPlotChart` | Statistical box plot | `data`, `categories` |
| `MapChart` | Geographical scatter | `data`, `lat`, `lng`, `value`, `name` |
| `GanttChart` | Project timeline 🆕 | `tasks` `[{name, start, end, progress}]` |
| `DAGChart` | Directed acyclic graph 🆕 | `nodes`, `edges`, `layout` |
| `CorrelationMatrix` | Correlation heatmap 🆕 | `matrix`, `labels` |
### 🧠 AI & Data Sources (3)
| Block | Description | Key Props |
|---|---|---|
| `AIInsight` | LLM-powered data narrative 🆕 | `data`, `provider`, `prompt`, `api_key` |
| `GoogleSheet` | Google Sheets data source 🆕 | `spreadsheet_id`, `sheet_name`, `range` |
| `SqlBlock` | Client-side SQL queries 🆕 | `query`, `data`, `output` |
### 📈 Metrics (6)
| Block | Description | Key Props |
|---|---|---|
| `KPI` | Key metric card with delta + tooltips | `label`, `value`, `unit`, `delta`, `status`, `tooltip_detail` |
| `Metric` | Compact inline metric | `label`, `value`, `unit`, `icon` |
| `ProgressBar` | Progress indicator | `label`, `value`, `max`, `color` |
| `StatComparison` | Side-by-side comparison | `title`, `items` |
| `Scorecard` | Conditional color metric grid 🆕 | `data`, `columns`, `thresholds` |
| `DataProfile` | Auto-EDA summary cards 🆕 | `columns` `[{name, dtype, count, ...}]` |
### 📝 Content (12)
| Block | Description | Key Props |
|---|---|---|
| `DataTable` | Searchable table + conditional formatting | `data`, `columns`, `formatting`, `downloadable` |
| `Markdown` | Rich text content | `content` |
| `CodeBlock` | Syntax-highlighted code | `code`, `language`, `title` |
| `Image` | Image display | `src`, `alt`, `caption` |
| `Alert` | Callout / notification | `severity`, `title`, `message` |
| `Timeline` | Vertical event timeline | `events` `[{date, title, description}]` |
| `Callout` | Styled quote / highlight | `content`, `author`, `variant` |
| `JsonViewer` | Interactive JSON tree | `data`, `collapsed_depth` |
| `UserCard` | Team member card | `name`, `role`, `avatar_url`, `stats` |
| `StatusList` | Status indicators list | `items` `[{label, status, value}]` |
| `InfoList` | Key-value pair display | `items` `[{key, value, icon}]` |
| `Sparkline` | Tiny inline chart | `data`, `color`, `show_area` |
| `NarrationBlock` | Voice narration (Web Speech API) 🆕 | `text`, `autoplay` |
### 📐 Layout (8)
| Block | Description | Key Props |
|---|---|---|
| `Section` | Group blocks with a heading | `title`, `description`, `children` |
| `Columns` | Multi-column responsive grid | `children`, `widths` |
| `Tabs` | Tabbed content panels | `tabs` (list of `{label, children}`) |
| `Divider` | Visual separator line | `label`, `variant` |
| `Accordion` | Collapsible content panels | `panels` (list of `{title, children}`) |
| `Stepper` | Process / wizard steps | `steps` `[{label, description, status}]` |
| `TagList` | Colored tag/badge chips | `tags` `[{label, color}]` |
| `Compare` | Side-by-side comparison layout 🆕 | `left_label`, `right_label`, `left_children`, `right_children` |
### 🎮 Interactive (9)
| Block | Description | Key Props |
|---|---|---|
| `Slider` | Range slider input | `label`, `min`, `max`, `default_value` |
| `NumberInput` | Numeric input field | `label`, `default_value`, `step` |
| `Toggle` | On/off switch | `label`, `default_value` |
| `Dropdown` | Select from options | `label`, `options`, `default_value` |
| `TextInput` | Text / textarea input | `label`, `placeholder`, `multiline` |
| `CheckboxGroup` | Multiple checkboxes | `label`, `options`, `default_values` |
| `RadioGroup` | Single-select radio buttons | `label`, `options`, `default_value` |
| `Embed` | Iframe embed | `url`, `height`, `aspect_ratio` |
| `Video` | HTML5 video player | `src`, `poster`, `controls` |
---
## 🎨 Themes
Three built-in themes ship out of the box:
```python
report = Report(title="Report", theme="dark") # 🌙 Deep dark, vibrant accents
report = Report(title="Report", theme="light") # ☀️ Clean, professional, airy
report = Report(title="Report", theme="executive") # 👔 Premium serif with rich greens
```
Each theme defines a complete design system: colors, typography (Inter / Georgia), spacing, shadows, and an 8-color chart palette.
🌙 Dark
Glassmorphism cards, vibrant accents
Ideal for internal dashboards
☀️ Light
Clean, professional, print-ready
Ideal for client-facing reports
👔 Executive
Gold accents, serif typography
Ideal for board presentations
---
## 📚 Examples
### Minimal Status Page
```python
from holysheet import Report, KPI, Markdown, Alert
report = Report(title="System Status", theme="dark")
report.add(Alert(severity="success", title="All Systems Operational", message="Last checked: 2 minutes ago"))
report.add(KPI(label="Uptime", value=99.97, unit="%", status="positive"))
report.add(KPI(label="Response Time", value=142, unit="ms", status="neutral"))
report.add(KPI(label="Error Rate", value=0.03, unit="%", delta="-0.01%", status="positive"))
report.add(Markdown(content="Monitored endpoints: **API**, **Auth**, **CDN**, **Database**"))
report.export_html("status.html")
```
### Executive Dashboard with Sections & Columns
```python
from holysheet import Report, KPI, LineChart, BarChart, DataTable, Section, Columns, Markdown
report = Report(
title="AIFlow Executive Report",
subtitle="Portfolio risk and delivery intelligence",
theme="executive",
author="Strategy Team",
)
# Executive summary
report.add(Markdown(content="""
## Executive Summary
Portfolio health remains strong with 42 active projects delivering on schedule.
Risk-adjusted returns are trending positively, with a 12% improvement in delivery confidence.
"""))
# Note: Variables like risk_df, team_df, projects_df should be your DataFrames
# KPI grid inside a section
report.add(Section(
title="Key Metrics",
children=[
KPI(label="Active Projects", value=42, delta="+3", status="positive"),
KPI(label="On-Track", value=87, unit="%", status="positive"),
KPI(label="At-Risk", value=5, status="negative"),
KPI(label="Budget Utilization", value=76, unit="%", status="neutral"),
],
))
# Side-by-side charts
report.add(Columns(children=[
LineChart(title="Risk Score Trend", data=risk_df, x="date", y="score"),
BarChart(title="Delivery by Team", data=team_df, x="team", y="delivered"),
]))
# Detailed data
report.add(DataTable(
title="Project Details",
data=projects_df,
columns=["project", "owner", "risk", "status", "completion"],
))
report.export_html("executive_report.html")
```
### Multi-Chart Analytics with Tabs
```python
from holysheet import Report, Tabs, LineChart, BarChart, PieChart, FunnelChart
report = Report(title="Sales Analytics", theme="dark")
report.add(Tabs(tabs=[
{
"label": "📈 Trends",
"children": [
LineChart(title="Monthly Sales", data=sales_df, x="month", y="total"),
LineChart(title="Customer Growth", data=growth_df, x="month", y="customers"),
],
},
{
"label": "📊 Breakdown",
"children": [
BarChart(title="Sales by Region", data=region_df, x="region", y="sales"),
PieChart(title="Product Mix", data=product_df, name="product", value="revenue"),
],
},
{
"label": "🔄 Pipeline",
"children": [
FunnelChart(title="Sales Funnel", data=funnel_df, name="stage", value="count"),
],
},
]))
report.export_html("sales_analytics.html")
```
🖼️ Example Output — Sales Dashboard (Executive Theme)
Generated by examples/sales_dashboard.py — a single self-contained HTML file
> 💡 **More examples** in the [`examples/`](examples/) directory — including a full showcase with every block type.
---
## 📤 Export Modes
### Standalone HTML *(default)*
```python
report.export_html("report.html")
```
Generates a **single, self-contained HTML file** (~1.5 MB) with embedded React, CSS, and data. Zero external dependencies. Open directly in any browser.
### Folder Export
```python
report.export_folder("dist/")
```
Generates a deployable folder structure:
```
dist/
index.html ← Entry point
assets/
app.js ← React bundle
app.css ← Styles
report.json ← Dashboard spec
```
Ideal for hosting on a web server, S3, or CDN.
### PDF Export
```python
report.export_pdf("report.pdf", landscape=True, margin="0.5in")
```
Requires Playwright (`pip install holysheet[pdf]`) or Chrome/Chromium.
### JSON Export
```python
report.export_json("report.json")
```
Exports just the dashboard specification as JSON. Useful for debugging, version control, or feeding into external rendering pipelines.
---
## 🗄️ Data Formats
HolySheet auto-detects and converts data from multiple formats:
```python
# ✅ List of dicts
data = [{"name": "Alice", "score": 95}, {"name": "Bob", "score": 87}]
# ✅ Dict of lists
data = {"name": ["Alice", "Bob"], "score": [95, 87]}
# ✅ Pandas DataFrame
import pandas as pd
data = pd.DataFrame({"name": ["Alice", "Bob"], "score": [95, 87]})
# ✅ Polars DataFrame
import polars as pl
data = pl.DataFrame({"name": ["Alice", "Bob"], "score": [95, 87]})
```
All formats are normalized to records internally via `holysheet.data.to_records()`.
---
## 💻 CLI
```bash
# Validate a report spec
holysheet validate report.json
# Serve a report locally (opens browser)
holysheet serve report.json
# Hot-reload dev server — auto-refreshes on Python script changes
holysheet dev my_report.py --port 8000
# Lint a report for best practices
holysheet lint my_report.py --strict
# Compare two report versions
holysheet diff old_report.json new_report.json
# Show version
holysheet version
# Publish to S3 or Google Cloud Storage
holysheet publish report.html -t s3://my-bucket/reports/q4.html --public
holysheet publish report.html -t gs://my-bucket/reports/q4.html
```
---
## 🔥 Advanced Features
### Custom Themes
```python
from holysheet import Report, Theme
brand = Theme(name="acme", primary="#FF6B00", background="#0A0A0F", font="Satoshi")
report = Report(title="Acme Report", theme=brand)
```
### Multi-Page Reports
```python
report.add_page("Overview", [KPI(label="Revenue", value="$1.2M")])
report.add_page("Details", [DataTable(title="Breakdown", data=df)])
```
### Chart Annotations
```python
report.add(LineChart(
title="Revenue", data=df, x="month", y="revenue",
annotations=[{"x": "Mar", "text": "Product Launch", "color": "#22d3ee"}]
))
```
### Global Filters
```python
report.add_filter("region", type="dropdown", options=["NA", "EU", "APAC"])
```
### Jupyter Integration
```python
report.show() # Renders inline in Jupyter notebook
```
### Password Protection & Expiry
```python
report.export_html("secure.html", password="s3cret") # AES-256 encrypted
Report(title="Temp", expires="2025-12-31") # Auto-expires
```
### Report Templates
```python
from holysheet.templates import SalesDashboard, ExecutiveSummary, OpsMonitor
blocks = SalesDashboard(data={"kpis": {"revenue": "$1.2M", "deals_won": 42}})
```
### Anomaly Detection
```python
report.add(LineChart(
title="Server Latency", data=metrics, x="time", y="latency_ms",
anomaly_detection=True, # Auto-detect and annotate outliers
))
```
### AI-Powered Insights
```python
from holysheet import AIInsight
report.add(AIInsight(title="Key Findings", data=df, provider="openai"))
```
### SQL Block
```python
from holysheet import SqlBlock
report.add(SqlBlock(
query="SELECT region, SUM(revenue) FROM data GROUP BY region",
data=sales_df,
))
```
### Voice Narration
```python
from holysheet import NarrationBlock
report.add(NarrationBlock(text=report.auto_narrate()))
```
---
## 🏗️ Architecture
```
Python API → Pydantic v2 Schema → JSON Spec → React Renderer → HTML Dashboard
```
HolySheet operates in two distinct phases:
### 🔧 Build Time *(Python — your machine)*
1. You define blocks using the Python API
2. HolySheet validates everything with **Pydantic v2** models
3. Generates a versioned JSON dashboard specification
4. Injects the spec into a **prebuilt React application**
5. Exports a self-contained HTML file via **Jinja2** templates
### 🌐 Runtime *(Browser — any machine)*
1. Browser opens the HTML file (no server needed)
2. React reads the embedded dashboard spec from ``
3. Renders each block through a **component registry** (`type` → React component)
4. Charts become interactive via **Apache ECharts**
5. Tables support real-time search and pagination
> **The key insight:** The React app is **prebuilt and bundled inside the Python package**. End users never need Node.js, npm, or any frontend tooling.
### Project Structure
```
HolySheet/
src/holysheet/ # Python package
__init__.py # Public API (20 block types + Report)
blocks.py # Pydantic v2 block models
schema.py # Report schema model
report.py # Main Report class + export methods
data.py # Data normalization (pandas/polars/dict/list)
exporters.py # HTML / folder / JSON exporters
themes.py # Theme system (light / dark / executive)
exceptions.py # Custom exception hierarchy
cli.py # Click-based CLI (validate, serve, version)
renderer/ # Prebuilt React assets (JS + CSS)
templates/ # Jinja2 HTML templates
frontend/ # React source (development only)
src/
components/ # React block components
theme.ts # MUI theme definitions
registry.tsx # Block type → component mapping
types.ts # TypeScript interfaces
tests/ # Python test suite
examples/ # Example scripts
```
---
## 🛠️ Development
### Prerequisites
- Python **3.11+**
- Node.js **18+** *(frontend development only)*
- Make
### Setup
```bash
git clone https://github.com/UnicoLab/HolySheet.git
cd HolySheet
# Full development setup (frontend + Python)
make dev
# Or step by step:
make frontend-install # Install frontend npm dependencies
make frontend-build # Build React app → src/holysheet/renderer/
make install # Install Python package in editable mode
```
### Common Commands
```bash
make test # Run Python test suite
make lint # Lint with ruff
make typecheck # Type-check with mypy (strict mode)
make format # Auto-format with ruff
make build # Build distributable wheel + sdist
make clean # Clean all build artifacts
```
### Releases
HolySheet uses [python-semantic-release](https://github.com/python-semantic-release/python-semantic-release) with conventional commits:
| Prefix | Effect |
|---|---|
| `feat:` | Minor version bump |
| `fix:` / `perf:` | Patch version bump |
| `BREAKING CHANGE:` | Major version bump |
---
## 🗺️ Roadmap
- [x] 📊 Advanced chart types (Sankey, Gantt, DAG, Correlation Matrix)
- [x] 🔍 Interactive filters and global filter bar
- [x] 📑 Multi-page tabbed report navigation
- [x] 🎨 Custom theme API + enterprise branding
- [x] 🔐 Password-protected & expiring reports
- [x] 📥 CSV download buttons on tables & charts
- [x] 📓 Jupyter notebook integration
- [x] 🎯 Chart annotations (vertical lines, point markers)
- [x] 📽️ Presentation mode (sections as slides)
- [x] 🌗 Dark/Light theme toggle in viewer
- [x] 🏗️ Report templates (SalesDashboard, ExecutiveSummary, OpsMonitor)
- [x] 🔧 Hot-reload dev server + report linting + report diff CLI
- [x] 🤖 AI narrative blocks (AIInsight with OpenAI / Anthropic / Google)
- [x] 📄 PDF export (Playwright / Chrome)
- [x] 🗄️ SQL Block (client-side query engine)
- [x] 🔊 Voice narration (Web Speech API)
- [x] 📈 Anomaly detection on charts (IQR + MAD)
- [x] ☁️ Cloud publish CLI (S3 / GCS)
- [x] 📊 Google Sheets data source
- [x] 🔄 Cross-block reactive filtering
- [x] 📜 Virtual scrolling for large tables
- [x] 🗺️ Report navigator (minimap)
- [x] 📱 PWA mode + responsive layouts
- [ ] 📊 PowerPoint export
- [ ] 🧩 Custom React component injection
- [ ] 💬 Local chatbot over report data
---
## 🤝 Contributing
Contributions are welcome! Here's how to get started:
1. **Fork** the repository
2. **Create** a feature branch: `git checkout -b feat/amazing-feature`
3. **Write** your changes with tests
4. **Check** everything passes: `make lint && make typecheck && make test`
5. **Commit** with [conventional commits](https://www.conventionalcommits.org/): `feat:`, `fix:`, `docs:`, etc.
6. **Open** a Pull Request
See the [Contributing Guide](CONTRIBUTING.md) for detailed instructions.
---
## 📄 License
MIT License — see [LICENSE](LICENSE) for details.
---
<p align="center">
Built with ❤️ by <a href="https://github.com/UnicoLab">UnicoLab</a>
</p>
<p align="center">
<sub>Holy Sheet, that's a beautiful dashboard! 🙌</sub>
</p>
<p align="center">
<sub>
<a href="https://pypi.org/project/holysheet">PyPI</a> ·
<a href="https://unicolab.github.io/holysheet">Documentation</a> ·
<a href="https://github.com/UnicoLab/holysheet/issues">Issues</a> ·
<a href="https://github.com/UnicoLab/holysheet/discussions">Discussions</a>
</sub>
</p>