https://github.com/upsetjs/upsetjs_powerbi_visuals
😠 UpSet.js PowerBI Custom Visuals
https://github.com/upsetjs/upsetjs_powerbi_visuals
chart powerbi powerbi-custom-visuals powerbi-visuals upsetjs
Last synced: 8 months ago
JSON representation
😠 UpSet.js PowerBI Custom Visuals
- Host: GitHub
- URL: https://github.com/upsetjs/upsetjs_powerbi_visuals
- Owner: upsetjs
- License: other
- Created: 2020-04-18T15:31:09.000Z (about 6 years ago)
- Default Branch: main
- Last Pushed: 2025-10-04T19:15:13.000Z (9 months ago)
- Last Synced: 2025-10-04T21:21:17.163Z (9 months ago)
- Topics: chart, powerbi, powerbi-custom-visuals, powerbi-visuals, upsetjs
- Language: TypeScript
- Homepage: https://upset.js.org
- Size: 4.81 MB
- Stars: 0
- Watchers: 1
- Forks: 0
- Open Issues: 1
-
Metadata Files:
- Readme: README.md
- License: LICENSE.md
Awesome Lists containing this project
README
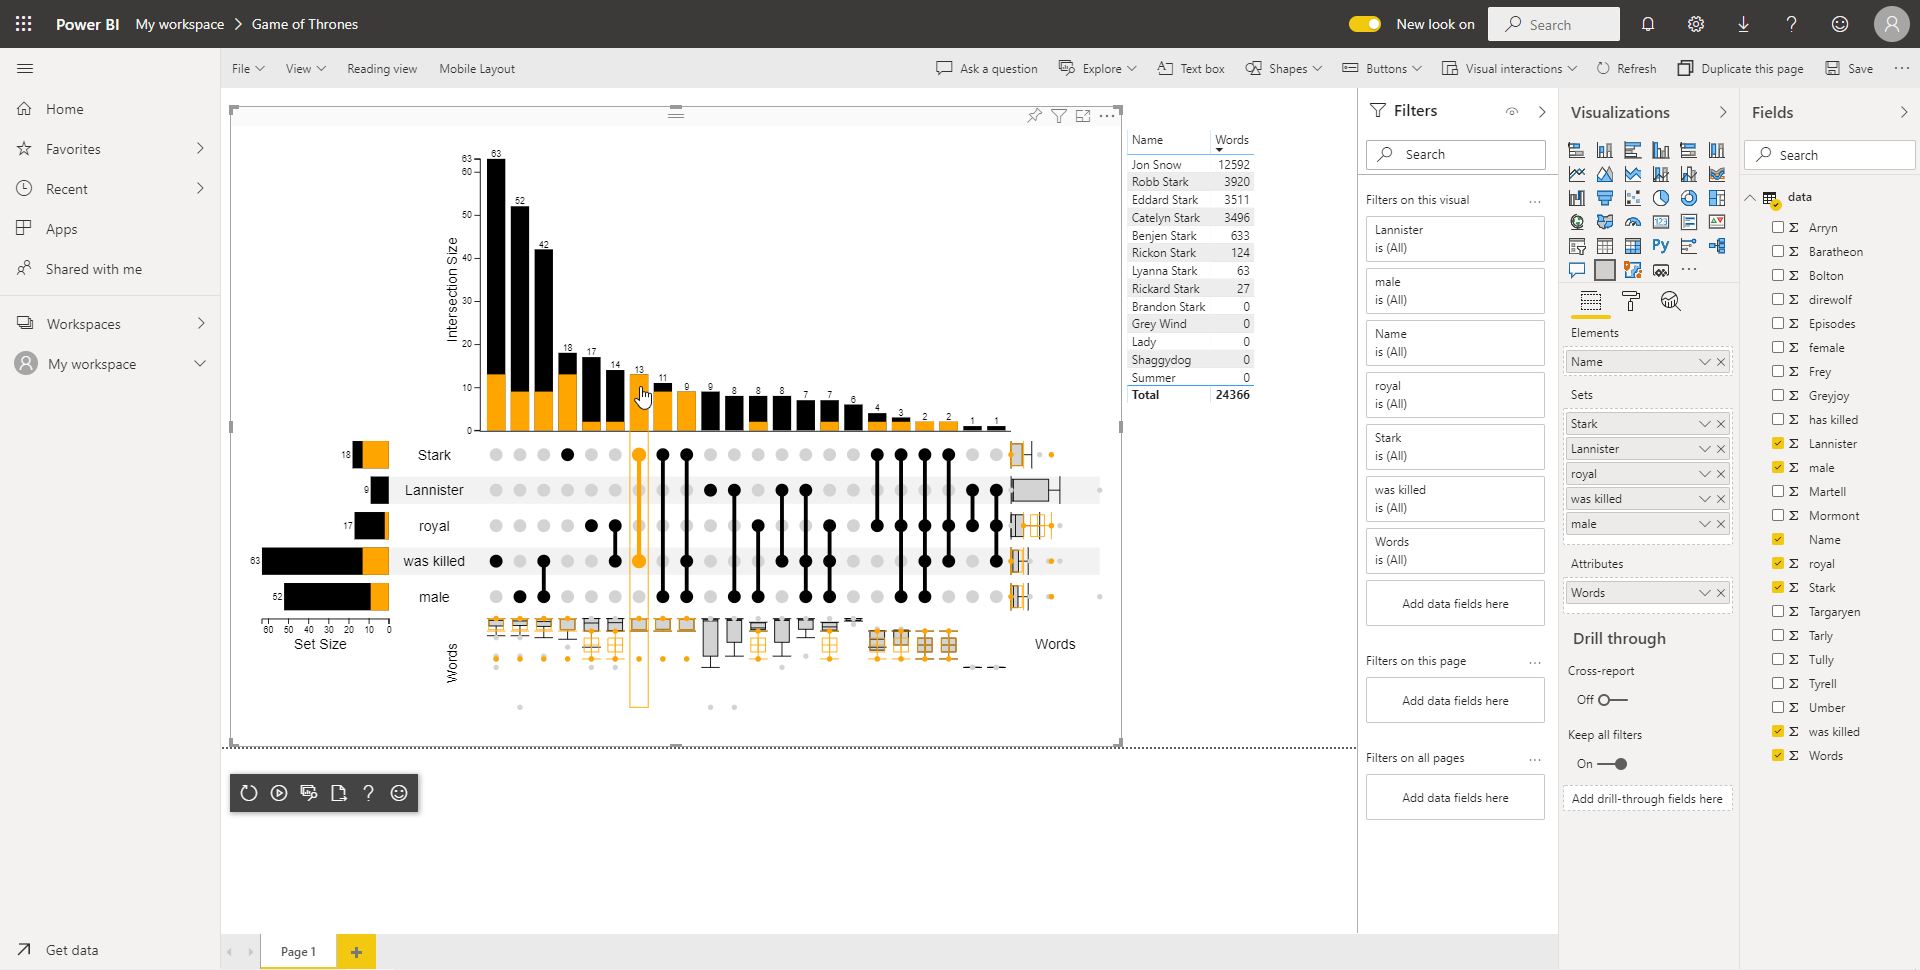
# UpSet.js as PowerBI Visual
[![Github Actions][github-actions-image]][github-actions-url]
This is a [PowerBI Custom Visual](https://powerbi.microsoft.com/en-us/developers/custom-visualization/?cdn=disable) for rendering [UpSet.js](https://upset.js.org).
This package is part of the UpSet.js ecosystem located at the main [Github Monorepo](https://github.com/upsetjs/upsetjs).
see also [Sample GoT PBIX file](https://upset.js.org/integrations/powerbi/got.pbix) or [Sample PBIX file](https://upset.js.org/integrations/powerbi/sample.pbix)
## Installation
Download the latest package from [https://upset.js.org/integrations/powerbi/upsetjs_preview.pbiviz](https://upset.js.org/integrations/powerbi/upsetjs_preview.pbiviz) and install into your PowerBI environment.
## Data Roles
The UpSet.js visual has three data roles:
- `Elements` exactly one grouping with a unique identifier for each row (e.g., a name)
- `Sets` one or more measures or groupings which represent the sets. When it's value at row `i` results in a trueish value (e.g., 1, true, ...) UpSet.js will interpret it that the element at row `i` is part of this set
- `Attributes` zero or more numeric measures that are used to generate boxplots for each set intersection
In addition, the visual supports various styling options including the customization of how the set combinations are generated.
## Interaction
The UpSet.js visual reacts to selections from other widgets by highlighting the elements in its chart. Moreover, when the user **clicks** on an element in the chart, the corresponding set (combination) will be selected.
## Venn Diagram
In addition, there is a sibling extension for rendering Venn and Euler Diagrams:

see also [Sample PBIX file](https://upset.js.org/integrations/powerbi/got_venn.pbix)
### Installation
Download the latest package from [https://upset.js.org/integrations/powerbi/upsetjs_venn_preview.pbiviz](https://upset.js.org/integrations/powerbi/upsetjs_venn_preview.pbiviz) and install into your PowerBI environment.
### Data Roles
The UpSet.js visual has two data roles:
- `Elements` exactly one grouping with a unique identifier for each row (e.g., a name)
- `Sets` one or more measures or groupings which represent the sets. When it's value at row `i` results in a trueish value (e.g., 1, true, ...) UpSet.js will interpret it that the element at row `i` is part of this set
In addition, the visual supports various styling options including the customization of whether a Venn or an Euler diagram should be generated.
## Dev Environment
see also https://docs.microsoft.com/en-us/power-bi/developer/visuals/environment-setup
```sh
npm i
npm run pbiviz -- --install-cert
```
### Test Server
```sh
npm start
```
### Commands
```sh
npm run lint
npm run fix
npm run build
npm run release
```
### Submission
1. Create a new release
1. Update the sample dataset with the latest version
1. Send a mail to pbivizsubmit@microsoft.com.
subject: UpSet Plot vX.X.X
content: ?
attachments: the pbiviz and the sample report
1. Wait for app package XML response
1. Go to https://partner.microsoft.com/de-de/dashboard/office/products/d350d8dc-2e28-41b2-b7b4-87e8510b8dc7/packages and upload the new XML file
1. Check the package and Publish
## Privacy Policy
UpSet.js is a client only library. The library or any of its integrations doesn't track you or transfers your data to any server. The uploaded data in the app are stored in your browser only using IndexedDB. The Tableau extension can run in a sandbox environment prohibiting any server requests. However, as soon as you export your session within the app to an external service (e.g., Codepen.io) your data will be transferred.
## License / Terms of Service
### Commercial license
If you want to use UpSet.js for a commercial application or in a commercial environment, the commercial license is the appropriate license. Contact [@sgratzl](mailto:sam@sgratzl.com) for details.
### Open-source license
This library is released under the `GNU AGPLv3` version to be used for private and academic purposes.
In case of a commercial use, please get in touch regarding a commercial license.
[github-actions-image]: https://github.com/upsetjs/upsetjs_powerbi_visuals/workflows/ci/badge.svg
[github-actions-url]: https://github.com/upsetjs/upsetjs_powerbi_visuals/actions
[codepen]: https://img.shields.io/badge/CodePen-open-blue?logo=codepen