https://github.com/valb3r/jsimpleplots
Simple plotting library (facade) for java/kotlin using Jzy3d. Allows to create plots easily
https://github.com/valb3r/jsimpleplots
chart charts java kotlin plot
Last synced: 5 months ago
JSON representation
Simple plotting library (facade) for java/kotlin using Jzy3d. Allows to create plots easily
- Host: GitHub
- URL: https://github.com/valb3r/jsimpleplots
- Owner: valb3r
- Created: 2023-07-17T18:39:36.000Z (almost 3 years ago)
- Default Branch: main
- Last Pushed: 2024-11-04T07:34:38.000Z (over 1 year ago)
- Last Synced: 2025-04-10T05:39:50.593Z (about 1 year ago)
- Topics: chart, charts, java, kotlin, plot
- Language: Kotlin
- Homepage:
- Size: 662 KB
- Stars: 2
- Watchers: 1
- Forks: 0
- Open Issues: 4
-
Metadata Files:
- Readme: README.md
Awesome Lists containing this project
README
[](https://jitpack.io/#valb3r/JSimplePlots)
# What is this
This is simple plot helper library that uses [**awesome Jzy3D**](https://github.com/jzy3d/jzy3d-api) for all heavy lifting. The idea is to implement Fluent-API
that describes available actions and is short and concise.
# Need to draw a plot from IntelliJ using Kotlin (or Java)?
[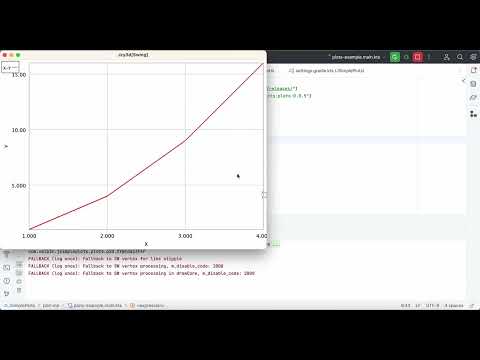](https://www.youtube.com/watch?v=D9aX8-E5eY8)
# Need to draw a plot from terminal?
**(Note: You should have Java and sdkman installed)**
[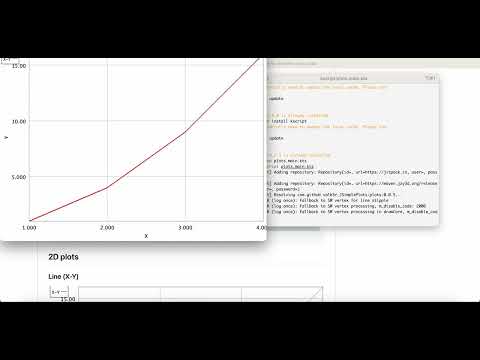](https://www.youtube.com/watch?v=X-sY0ijm6JA)
# Usage
## Add library
### Maven
```xml
jitpack.io
https://jitpack.io
maven.jzy3d.org
https://maven.jzy3d.org/releases/
com.github.valb3r.JSimplePlots
plots
0.0.13
```
### Gradle
```groovy
repositories {
maven { url 'https://jitpack.io' }
maven { url 'https://maven.jzy3d.org/releases/' }
}
dependencies {
implementation 'com.github.valb3r.JSimplePlots:plots:0.0.11'
}
```
# Examples
## Kotlin
## Plot directly from kotlin script:
(I.e. download `kscript` as described [here](https://github.com/kscripting/kscript), or run it from IntelliJ from file that has `.main.kts` extension, i.e. as [here](examples/kotlin/jumpstart.main.kts))
```kotlin
@file:Repository("https://jitpack.io")
@file:Repository("https://maven.jzy3d.org/releases/")
@file:DependsOn("com.github.valb3r.JSimplePlots:plots:0.0.11")
import com.valb3r.jsimpleplots.plots.SimplePlots
SimplePlots.xy()
.x(floatArrayOf(1.0f, 2.0f, 3.0f, 4.0f))
.y(floatArrayOf(1.0f, 4.0f, 9.0f, 16.0f))
.width(5)
.plot()
```
## 2D plots
### Line (X-Y)

```kotlin
SimplePlots.xy()
.x(floatArrayOf(1.0f, 2.0f, 3.0f, 4.0f))
.y(floatArrayOf(1.0f, 4.0f, 9.0f, 16.0f))
.plot()
```
### Multiple plots (X-Y)

```kotlin
val parabola = SimplePlots.xy()
.x(floatArrayOf(1.0f, 2.0f, 3.0f, 4.0f, 5.0f, 6.0f))
.y(floatArrayOf(1.0f, 4.0f, 9.0f, 16.0f, 25.0f, 36.0f))
.width(5)
.named("Parabola")
val cubic = SimplePlots.xy()
.x(floatArrayOf(1.0f, 2.0f, 3.0f, 4.0f, 5.0f, 6.0f))
.y(floatArrayOf(1.0f, 8.0f, 27.0f, 64.0f, 125.0f, 216.0f))
.width(5)
.named("Cubic")
SimplePlots.multiple()
.add(parabola)
.add(cubic)
.plot()
```
### Dynamic plot (X-Y)

```kotlin
val aPlot = xy()
.x(floatArrayOf(1.0f, 2.0f, 3.0f, 4.0f))
.y(floatArrayOf(1.0f, 4.0f, 9.0f, 16.0f))
.plot()
for (i in 0..9) {
aPlot.addPt(Math.random() * 10.0, Math.random() * 10.0, true)
try { Thread.sleep(1000L) } catch (ignored: InterruptedException) { }
}
```
### Fast-Fourier-Transform

```kotlin
SimplePlots.fft()
.y(data)
.samplingFrequency(samplingFrequency)
.plot()
```
### Saving plot to file
```kotlin
SimplePlots.xy()
.x(floatArrayOf(1.0f, 2.0f, 3.0f, 4.0f))
.y(floatArrayOf(1.0f, 4.0f, 9.0f, 16.0f))
.screenshot()
.saveToFile(File("xy.png"))
```
## 3D plots
### Heatmap

```kotlin
SimplePlots.heatmap()
.x(floatArrayOf(1.0f, 2.0f, 3.0f, 4.0f, 1.0f, 2.0f, 3.0f, 4.0f, 1.0f, 2.0f, 3.0f, 4.0f, 1.0f, 2.0f, 3.0f, 4.0f))
.y(floatArrayOf(1.0f, 1.0f, 1.0f, 1.0f, 2.0f, 2.0f, 2.0f, 2.0f, 3.0f, 3.0f, 3.0f, 3.0f, 4.0f, 4.0f, 4.0f, 4.0f))
.z(floatArrayOf(0.0f, 1.0f, 2.0f, 3.0f, 0.0f, 1.0f, 2.0f, 3.0f, 0.0f, 1.0f, 2.0f, 3.0f, 0.0f, 1.0f, 2.0f, 3.0f))
.plot()
```
### Surface

```kotlin
SimplePlots.surface()
.x(floatArrayOf(1.0f, 2.0f, 3.0f, 4.0f, 1.0f, 2.0f, 3.0f, 4.0f, 1.0f, 2.0f, 3.0f, 4.0f, 1.0f, 2.0f, 3.0f, 4.0f))
.y(floatArrayOf(1.0f, 1.0f, 1.0f, 1.0f, 2.0f, 2.0f, 2.0f, 2.0f, 3.0f, 3.0f, 3.0f, 3.0f, 4.0f, 4.0f, 4.0f, 4.0f))
.z(floatArrayOf(1.0f, 1.0f, 1.0f, 1.0f, 1.0f, 3.0f, 3.0f, 1.0f, 1.0f, 3.0f, 3.0f, 1.0f, 1.0f, 1.0f, 1.0f, 1.0f))
.plot()
```
### Fast fourier transform - waterfall (time domain + frequency domain)
```kotlin
SimplePlots.waterfallFft()
.y(data)
.chunkSize(100)
.samplingFrequency(samplingFrequency)
.plot()
```
## Plot contents of CSV file usage example
```kotlin
@file:Repository("https://jitpack.io")
@file:Repository("https://maven.jzy3d.org/releases/")
@file:DependsOn("com.github.valb3r.JSimplePlots:plots:0.0.11")
@file:DependsOn("com.github.valb3r.JSimplePlots:data-adapters:0.0.11")
import com.valb3r.jsimpleplots.data_adapters.DataAdapter
import com.valb3r.jsimpleplots.plots.SimplePlots
import java.io.File
val tempFile = File.createTempFile("plots", "data")
tempFile.writeText(
"""
X;Y
1;1
2;4
3;9
4;16
5;25
""".trimIndent()
)
val csv = DataAdapter.csv().of(tempFile)
SimplePlots.xy()
.x(csv["X"].float())
.y(csv["Y"].float())
.plot()
```
## Java
## 2D plots
### Line (X-Y)
```java
SimplePlots.INSTANCE.xy()
.x(new float[] {1.0f, 2.0f, 3.0f, 4.0f})
.y(new float[] {1.0f, 4.0f, 9.0f, 16.0f})
.plot();
```
### Multiple plots (X-Y)
```java
var parabola = SimplePlots.INSTANCE.xy()
.x(new float[] {1.0f, 2.0f, 3.0f, 4.0f})
.y(new float[] {1.0f, 4.0f, 9.0f, 16.0f})
.named("Parabola");
var cubic = SimplePlots.INSTANCE.xy()
.x(new float[] {1.0f, 2.0f, 3.0f, 4.0f})
.y(new float[] {1.0f, 8.0f, 27.0f, 64.0f})
.named("Cubic");
SimplePlots.INSTANCE.multiple()
.add(parabola)
.add(cubic)
.plot();
```
### Dynamic plot (X-Y)

```java
var aPlot = SimplePlots.INSTANCE.xy()
.x(new float[] {1.0f, 2.0f, 3.0f, 4.0f})
.y(new float[] {1.0f, 4.0f, 9.0f, 16.0f})
.plot();
for (int i = 0; i < 10; i++) {
aPlot.addPt(Math.random() * 10.0, Math.random() * 10.0, true);
try { Thread.sleep(1000L);} catch (InterruptedException ignored) {}
}
```
### Fast fourier transform
```java
SimplePlots.INSTANCE.fft()
.samplingFrequency(samplingFrequency)
.y(data)
.plot();
```
### Saving plot to file
```java
SimplePlots.INSTANCE.xy()
.x(new float[] {1.0f, 2.0f, 3.0f, 4.0f})
.y(new float[] {1.0f, 4.0f, 9.0f, 16.0f})
.screenshot()
.saveToFile(new File("xy.png"), "png", new Rectangle(500, 500));
```
## 3D plots
### Heatmap
```java
SimplePlots.INSTANCE.heatmap()
.x(new float[] {1.0f, 2.0f, 3.0f, 4.0f, 1.0f, 2.0f, 3.0f, 4.0f, 1.0f, 2.0f, 3.0f, 4.0f, 1.0f, 2.0f, 3.0f, 4.0f})
.y(new float[] {1.0f, 1.0f, 1.0f, 1.0f, 2.0f, 2.0f, 2.0f, 2.0f, 3.0f, 3.0f, 3.0f, 3.0f, 4.0f, 4.0f, 4.0f, 4.0f})
.z(new float[] {1.0f, 1.0f, 1.0f, 1.0f, 1.0f, 3.0f, 3.0f, 1.0f, 1.0f, 3.0f, 3.0f, 1.0f, 1.0f, 1.0f, 1.0f, 1.0f})
.plot();
```
### Surface
```java
SimplePlots.INSTANCE.surface()
.x(new float[] {1.0f, 2.0f, 3.0f, 4.0f, 1.0f, 2.0f, 3.0f, 4.0f, 1.0f, 2.0f, 3.0f, 4.0f, 1.0f, 2.0f, 3.0f, 4.0f})
.y(new float[] {1.0f, 1.0f, 1.0f, 1.0f, 2.0f, 2.0f, 2.0f, 2.0f, 3.0f, 3.0f, 3.0f, 3.0f, 4.0f, 4.0f, 4.0f, 4.0f})
.z(new float[] {1.0f, 1.0f, 1.0f, 1.0f, 1.0f, 3.0f, 3.0f, 1.0f, 1.0f, 3.0f, 3.0f, 1.0f, 1.0f, 1.0f, 1.0f, 1.0f})
.plot();
```
### Fast fourier transform - waterfall (time domain + frequency domain)
```java
SimplePlots.INSTANCE.waterfallFft()
.y(data)
.chunkSize(100)
.samplingFrequency(samplingFrequency)
.plot();
```
# FAQ
- **In case of java.awt.HeadlessException**: Add `-Djava.awt.headless=false` to JVM arguments
