https://github.com/vanessaaleung/venmo-text-analytics
Text Analytics on Venmo Transactions Data
https://github.com/vanessaaleung/venmo-text-analytics
data-science natural-language-processing nltk python text-mining
Last synced: 2 months ago
JSON representation
Text Analytics on Venmo Transactions Data
- Host: GitHub
- URL: https://github.com/vanessaaleung/venmo-text-analytics
- Owner: vanessaaleung
- Created: 2020-05-22T22:44:33.000Z (about 6 years ago)
- Default Branch: master
- Last Pushed: 2020-07-20T20:41:59.000Z (almost 6 years ago)
- Last Synced: 2025-02-25T21:34:04.667Z (over 1 year ago)
- Topics: data-science, natural-language-processing, nltk, python, text-mining
- Language: Jupyter Notebook
- Homepage:
- Size: 1.09 MB
- Stars: 1
- Watchers: 1
- Forks: 1
- Open Issues: 0
-
Metadata Files:
- Readme: README.md
Awesome Lists containing this project
README
# Venmo Text Analytics
Text Analytics on Venmo Transactions Data with Spark on Databricks
## Data
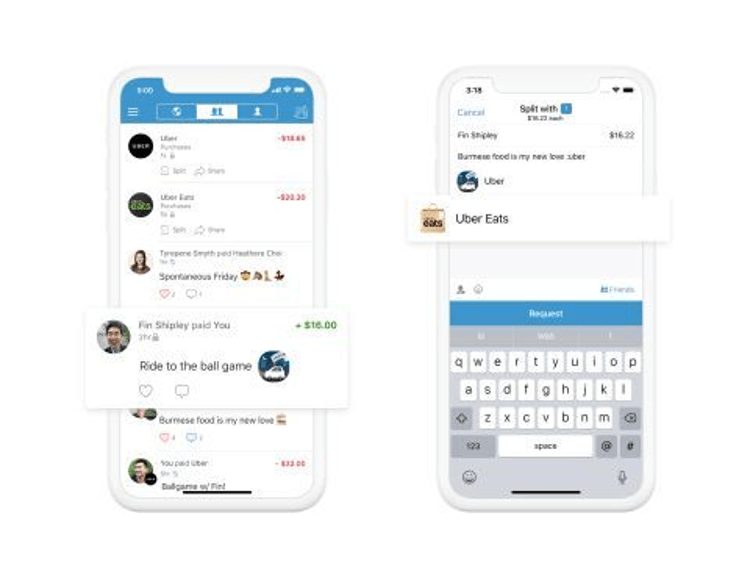
The data contains more than 7 millions transactions on Venmo.

## Approaches
### Step 1: Classify Transactions

We first utilized the [emojis](https://pypi.org/project/emojis/) package to convert emojis to text. Then we preprocessed the transaction description data by first removing the punctuations and stopwords, then tokenizing and lemmatizing the text data. After preprocessing the text data, we used the text dictionary provided to classify the transactions.
**Text Dictionary:**

**Emoji Dictionary**

### Step 2: Exploractory Data Analysis
Insights:
- 21% of transactions are emoji only
- the top 5 most popular emoji: '💸', '🍕', '🍻', '🎉', '🍷'
- the top three most popular emoji categories are Food, People, Activity
### Step 3: Create Static User Spending Behavior Profile

For each user, create a variable to indicate their spending behavior profile. For example, if a user has made 10 transactions, where 5 of them are food and the other 5 are activity, then the user’s spending profile will be 50% food and 50% activity.
We first reshaped the data by combining the transactions of user1 and user2. As we assumed that the transactions that can't be classified by the dictionary would not be considered in the spending behavior, we then calculated the static spending behavior profile for each user.
### Step 4: Create Dynamic User Spending Behavior Profile

Explore how a user’s spending profile is evolving over her lifetime in Venmo. First of all, you need to analyze a user’s transactions in monthly intervals, starting from 0 (indicating their first transaction only) up to 12. For each time point, you need to compute the average and standard deviation of each spending category across all users.
We first filtered the transactions that exceed the 12th time points for each user. Then we calculated the dynamic spending behavior profile for each user at each time point.
We then computed the average and standard deviation of each spending category across all users, at each time point, and plotted the average and average +/- 2 * standard deviation area. From the plot, we can see that most of the average spendings stabilized after customers’ first life point.
