https://github.com/vasturiano/horizon-timeseries-chart
A chart to represent time-series data using multiple vertically layered horizon area plots
https://github.com/vasturiano/horizon-timeseries-chart
chart d3js dataviz horizon multiple timeseries
Last synced: 4 months ago
JSON representation
A chart to represent time-series data using multiple vertically layered horizon area plots
- Host: GitHub
- URL: https://github.com/vasturiano/horizon-timeseries-chart
- Owner: vasturiano
- License: mit
- Created: 2018-09-27T05:05:01.000Z (about 7 years ago)
- Default Branch: master
- Last Pushed: 2025-03-21T15:38:25.000Z (8 months ago)
- Last Synced: 2025-07-03T13:55:49.765Z (5 months ago)
- Topics: chart, d3js, dataviz, horizon, multiple, timeseries
- Language: JavaScript
- Homepage: https://vasturiano.github.io/horizon-timeseries-chart/example/basic/
- Size: 3.06 MB
- Stars: 49
- Watchers: 5
- Forks: 7
- Open Issues: 1
-
Metadata Files:
- Readme: README.md
- License: LICENSE
Awesome Lists containing this project
- jimsghstars - vasturiano/horizon-timeseries-chart - A chart to represent time-series data using multiple vertically layered horizon area plots (JavaScript)
README
Horizon Time-series Chart
==============
[![NPM package][npm-img]][npm-url]
[![Build Size][build-size-img]][build-size-url]
[![NPM Downloads][npm-downloads-img]][npm-downloads-url]
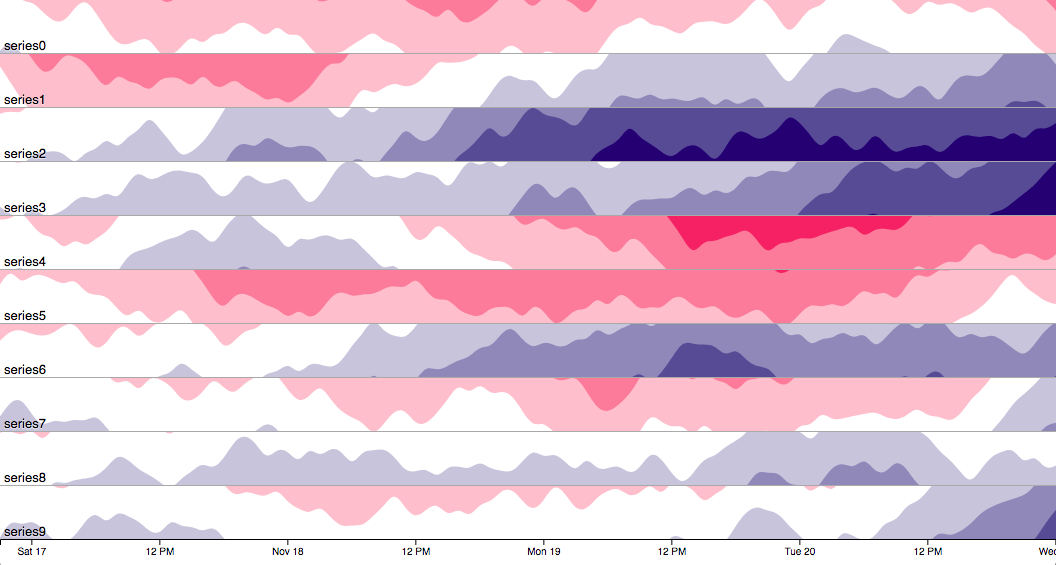
An interactive vertically stacked horizon chart to represent time-series data.
For more information on the Horizon visual representation method, please see [`d3-horizon`](https://github.com/vasturiano/d3-horizon).
[](https://nodei.co/npm/horizon-timeseries-chart/)
Check out the examples:
* [Basic multi-series with random generated data](https://vasturiano.github.io/horizon-timeseries-chart/example/basic/) ([source](https://github.com/vasturiano/horizon-timeseries-chart/blob/master/example/basic/index.html))
* [Zoom interaction on large data set](https://vasturiano.github.io/horizon-timeseries-chart/example/large-zoom/) ([source](https://github.com/vasturiano/horizon-timeseries-chart/blob/master/example/large-zoom/index.html))
* [Live-updating data insertion](https://vasturiano.github.io/horizon-timeseries-chart/example/live-update/) ([source](https://github.com/vasturiano/horizon-timeseries-chart/blob/master/example/live-update/index.html))
* [Currency heatmap](https://vasturiano.github.io/horizon-timeseries-chart/example/currency-heatmap/) ([source](https://github.com/vasturiano/horizon-timeseries-chart/blob/master/example/currency-heatmap/index.html))
## Quick start
```js
import HorizonTSChart from 'horizon-timeseries-chart';
```
or using a *script* tag
```html
```
then
```js
const myChart = new HorizonTSChart()
.data();
```
## API reference
| Method | Description | Default |
|---|---|:---:|
| width([px]) | Getter/setter for the chart width. | *<window width>* |
| height([px]) | Getter/setter for the chart height. This height will be divided equally between all the vertically stacked series. | *<window height>* |
| data([array]) | Getter/setter for the chart data, as an array of data points. The syntax of each item is defined by the `series`, `ts` and `val` accessor methods. | `[]` |
| series([string or fn]) | Getter/setter for the data point accessor function to extract the `series`. A `function` receives the data point as input and should return the unique series identifier. A string indicates the object attribute to use. | |
| seriesComparator([fn(a, b)]) | Getter/setter for the comparator function used to sort the series from top to bottom. The function should follow the signature `function(seriesA, seriesB)` and return a numeric value. | `(a, b) => a.localeCompare(b)` |
| seriesLabelFormatter([fn(series)]) | Getter/setter for the series label formatter function, used to show labels on the left-hand side of each series. The formatter should receive a series ID, as present in the data, and return a string. | `series => series` |
| ts([string or fn]) | Getter/setter for the data point accessor function to extract the x-axis timestamp. A `function` receives the data point as input and should return a number or a [Date](https://developer.mozilla.org/en-US/docs/Web/JavaScript/Reference/Global_Objects/Date) object indicating the point time. A string indicates the object attribute to use. | `ts` |
| val([string or fn]) | Getter/setter for the data point accessor function to extract the y-axis numeric value. A `function` receives the data point as input and should return a number. A string indicates the object attribute to use. | `val` |
| useUtc([boolean]) | Getter/setter for whether to consider and represent time using the local timezone (`false`) or in UTC (`true`). | `false` |
| use24h([boolean]) | Getter/setter for whether to show time in 24h or 12h (am/pm) format. | `true` |
| horizonBands([number]) | Getter/setter for the number of horizon bands to use. | 4 |
| horizonMode(['offset' or 'mirror']) | Getter/setter for the mode used to represent negative values. `offset` renders the negative values from the top of the chart downwards, while `mirror` represents them upwards as if they were positive values, albeit with a different color. | `offset` |
| yNormalize([boolean]) | Getter/setter for whether to normalize all series Y axis to the same extent, in order to compare series in absolute terms. It defines the behavior of the dynamic calculation of the max Y, when `yExtent` is not explicitly set. If `true`, the extent is calculated as the global maximum value of all the data points combined across all series. If `false`, each series extent will be based on their own local maximum. | `false` |
| yExtent([number or fn]) | Getter/setter for the series accessor function to set the y-axis maximum absolute value. By default (`undefined`), the max Y is calculated dynamically from the data. A `function` receives the series ID as input and should return a numeric value. A `number` sets the same extent for all the series. | `undefined` |
| yScaleExp([number or fn]) | Getter/setter for the series accessor function to set the y-axis scale exponent. Only values `> 0` are supported. An exponent of `1` (default) represents a linear Y scale. A `function` receives the series ID as input and should return a numeric value. A `number` sets the same scale exponent for all the series. | 1 |
| yAggregation([fn([numbers])]) | Getter/setter for the method to reduce multiple values to a single number, in case there is more than one `y` value per unique `ts` and `series`. | `vals => vals.reduce((a,b) => a+b)` (accumulate) |
| positiveColors([[colors] or fn]) | Getter/setter for the series accessor function to set the colors to use for the positive value bands. The top band gets assigned the max color, and the other bands are colored according to the interpolation of the color stops. Minimum two colors are required. | `['white', 'midnightBlue']` |
| positiveColorStops([[stopNumbers] or fn]) | Getter/setter for the series accessor function to set the stop values to use in the interpolation of the positive colors. Each stop represents an interpolation ratio and only values between ]0, 1[ (excluding) are permitted. The stops are used to interpolate the middle colors in `positiveColors` and are only applicable if there are more than 2 colors. If the number of stops is less than number of middle colors, linear interpolation is used to populate the remaining stops. A value of `undefined` (default) results in complete linear interpolation. | `undefined` |
| negativeColors([[colors] or fn]) | Getter/setter for the series accessor function to set the colors to use for the negative value bands. The top band gets assigned the max color, and the other bands are colored according to the interpolation of the color stops. Minimum two colors are required. | `['white', 'crimson']` |
| negativeColorStops([[stopNumbers] or fn]) | Getter/setter for the series accessor function to set the stop values to use in the interpolation of the negative colors. Each stop represents an interpolation ratio and only values between ]0, 1[ (excluding) are permitted. The stops are used to interpolate the middle colors in `negativeColors` and are only applicable if there are more than 2 colors. If the number of stops is less than number of middle colors, linear interpolation is used to populate the remaining stops. A value of `undefined` (default) results in complete linear interpolation. | `undefined` |
| interpolationCurve([d3CurveFn]) | Getter/setter for the interpolation curve function used to draw lines between points. Should be a [d3 curve function](https://github.com/d3/d3-shape#curves). A `falsy` value sets linear interpolation ([curveLinear](https://github.com/d3/d3-shape#curveLinear)). | [curveBasis](https://github.com/d3/d3-shape#curveBasis) |
| showRuler([boolean]) | Getter/setter for whether to show a vertical ruler highlighting the closest time point across all series. | `true` |
| enableZoom([boolean]) | Getter/setter for whether to enable pointer-based zoom interactions on the chart, along the time (x-axis) dimension. | `false` |
| transitionDuration([ms]) | Getter/setter for the duration (in milliseconds) of the transitions between data states. | 250 |
| tooltipContent([fn({series, ts, val, points})]) | Getter/setter for the tooltip content accessor function. Accepts plain-text or HTML. A value of `null` will permanently hide the tooltip. | ```({ series, ts, val }) => `${series}
${ts}: ${val}` ``` |
| onHover([fn({x, y, points})]) | Callback function for chart hover events. Gets triggered every time the mouse moves in/out of a different point hover area. Includes the point information as single argument, with `x`, `y` and `points` (list of all data points associated with the corresponding `x` value) data. If no point is in the `x` proximity of the mouse pointer, a value of `null` is returned instead. | - |
| onClick([fn({x, y, points})]) | Callback function for chart click events. Includes the currently hovered point information as single argument, with `x`, `y` and `points` (list of all data points associated with the corresponding `x` value) data. If no point is in the `x` proximity of the mouse pointer, a value of `null` is returned instead. | - |
## Giving Back
[](https://www.paypal.com/cgi-bin/webscr?cmd=_donations&business=L398E7PKP47E8¤cy_code=USD&source=url) If this project has helped you and you'd like to contribute back, you can always [buy me a ☕](https://www.paypal.com/cgi-bin/webscr?cmd=_donations&business=L398E7PKP47E8¤cy_code=USD&source=url)!
[npm-img]: https://img.shields.io/npm/v/horizon-timeseries-chart
[npm-url]: https://npmjs.org/package/horizon-timeseries-chart
[build-size-img]: https://img.shields.io/bundlephobia/minzip/horizon-timeseries-chart
[build-size-url]: https://bundlephobia.com/result?p=horizon-timeseries-chart
[npm-downloads-img]: https://img.shields.io/npm/dt/horizon-timeseries-chart
[npm-downloads-url]: https://www.npmtrends.com/horizon-timeseries-chart