https://github.com/vasturiano/treemap-chart
A treemap interactive chart web component for visualizing hierarchical data
https://github.com/vasturiano/treemap-chart
chart d3js data-visualization hierarchical-data treemap
Last synced: over 1 year ago
JSON representation
A treemap interactive chart web component for visualizing hierarchical data
- Host: GitHub
- URL: https://github.com/vasturiano/treemap-chart
- Owner: vasturiano
- License: mit
- Created: 2019-06-13T08:45:30.000Z (about 7 years ago)
- Default Branch: master
- Last Pushed: 2025-03-21T15:46:01.000Z (over 1 year ago)
- Last Synced: 2025-03-28T12:01:40.007Z (over 1 year ago)
- Topics: chart, d3js, data-visualization, hierarchical-data, treemap
- Language: JavaScript
- Homepage: https://vasturiano.github.io/treemap-chart/example/flare/
- Size: 813 KB
- Stars: 71
- Watchers: 2
- Forks: 16
- Open Issues: 8
-
Metadata Files:
- Readme: README.md
- License: LICENSE
Awesome Lists containing this project
README
treemap-chart
==================
[![NPM package][npm-img]][npm-url]
[![Build Size][build-size-img]][build-size-url]
[![NPM Downloads][npm-downloads-img]][npm-downloads-url]
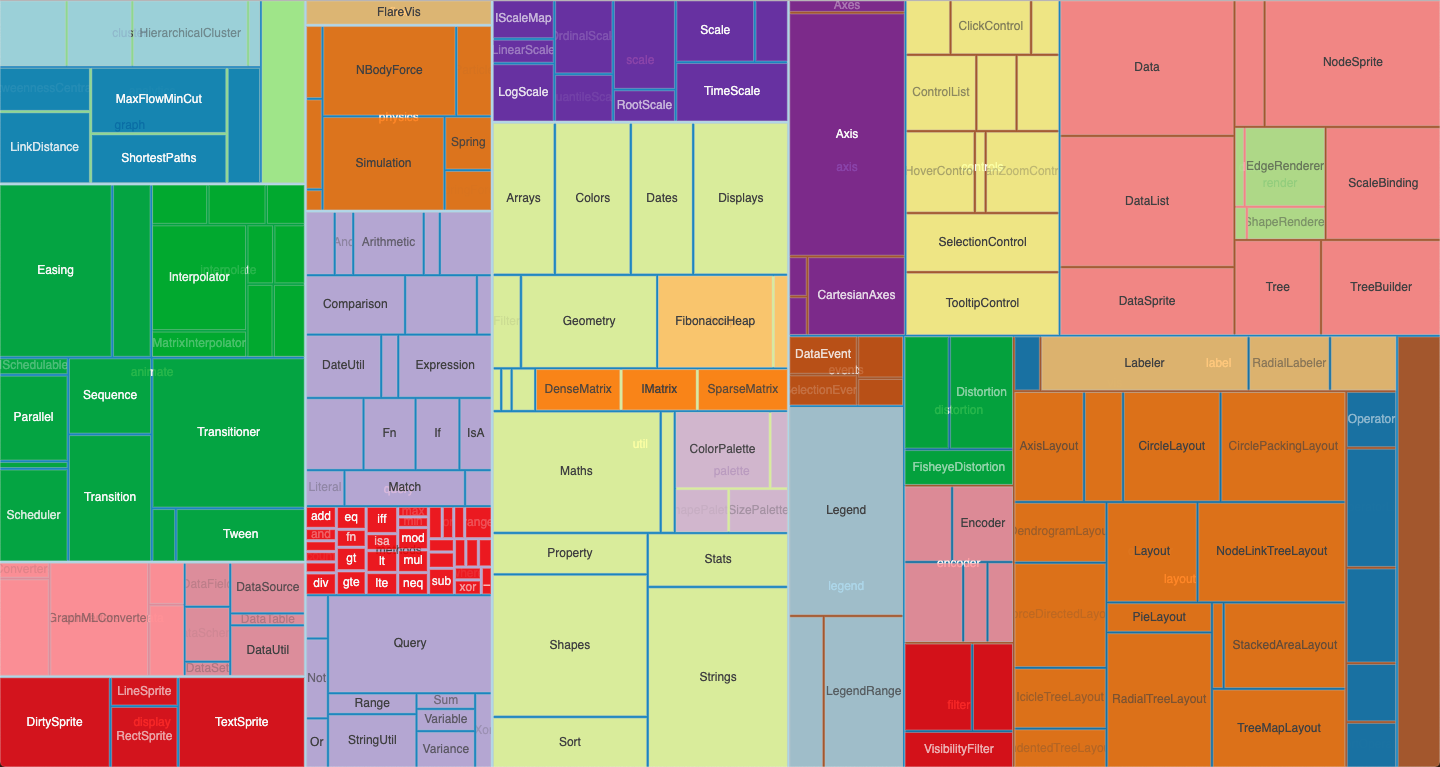
An interactive treemap chart for visualizing proportions in hierarchical data, where nodes of a tree are represented as nested fully-packed rectangular tiles.
Supports zooming interactions via mouse-wheel events or by clicking on a node, which focuses the viewport on the associated sub-tree.
The chart also responds to data changes by animating the dimensions of each of the nodes into their new positions.
For improved performance, nodes with area (`width`*`height`) smaller than a given threshold (`minBlockArea`) are excluded from the DOM, allowing for representation of large data sets while maintaining a smooth interaction. See [here for an example](https://vasturiano.github.io/treemap-chart/example/large-data) of a randomly generated large data structure.
See also the [Circle Pack](https://github.com/vasturiano/circlepack-chart), [Icicle](https://github.com/vasturiano/icicle-chart) and [Sunburst](https://github.com/vasturiano/sunburst-chart) charts.
## Quick start
```js
import Treemap from 'treemap-chart';
```
or using a *script* tag
```html
```
then
```js
const myChart = new Treemap()
.data();
```
## API reference
| Method | Description | Default |
| --- | --- | :--: |
| data([object]) | Getter/setter for chart data (see below for syntax details). | |
| width([number]) | Getter/setter for the chart width in px. | *<window width>* |
| height([number]) | Getter/setter for the chart height in px. | *<window height>* |
| children([string or fn]) | Getter/setter for a data node's children accessor, used to establish the hierarchical relationship between nodes. Supports either a string indicating the object's property name, or a `function(node)` which should return an array of nodes. | `children` |
| label([string or fn]) | Getter/setter for a node object label accessor, used to display labels on the blocks and their tooltips. | `name` |
| size([string or fn]) | Getter/setter for a node object size accessor, used to compute the areas of the blocks. | `value` |
| padding([number]) | Getter/setter for the amount of padding between adjacent blocks, in px. | `2.5` |
| color([string or fn]) | Getter/setter for a node object color accessor, used to color the blocks. | grey |
| nodeClassName([string or fn]) | Getter/setter for a node object classname accessor. Determines the CSS class(es) to apply to each block node. |
| minBlockArea([number]) | Getter/setter for the minimum area of a block (in square px) required for it to be rendered in the DOM. | `100` |
| excludeRoot([boolean]) | Getter/setter for whether to exclude the root node from the representation. | `false` |
| sort([fn]) | Getter/setter for the compare method used to sort sibling blocks. A value of `null` (*default*) maintains the existing order found in the input data structure. This method is equivalent to [d3-hierarchy's sort](https://github.com/d3/d3-hierarchy#node_sort), it receives two arguments representing two sibling nodes and expects a numeric return value (`-1`, `0` or `1`) indicating the order. Each element is an instance of [d3-hierarchy node](https://github.com/d3/d3-hierarchy#hierarchy) and has several useful properties to specify order: `data` (the corresponding data object), `value` (summed value of node and all its descendants) and `depth` (layer degree). For [example](https://vasturiano.github.io/treemap-chart/example/sort-by-size/), to order blocks by size, use: `(a, b) => b.value - a.value`. | *<existing order*> |
| showLabels([boolean]) | Getter/setter for whether to show labels in the nodes. Regardless of this setting, labels too large to fit within a block's width are automatically hidden. | `true` |
| showTooltip([fn]) | Getter/setter to specify a node object tooltip's visibility. If this function returns `false` for a particular node, that node's tooltip will not display at all. If unspecified, all nodes' tooltips will display. | `() => true` |
| tooltipTitle([fn]) | Getter/setter for a node object tooltip title. The function should return a string to be displayed in bold in the first line of the tooltip. If unspecified, the full hierarchical name will be displayed. | |
| tooltipContent([fn]) | Getter/setter for a node object tooltip content. Use this to specify extra content in each of the block's tooltips in addition to the title set in `tooltipTitle`. | |
| zoomToNode([node]) | Programmatically zoom the chart to a particular node. | |
| zoomBy([number]) | Programmatically zoom the chart by a specific amount. `1` is unity, above one indicates a zoom-in and below a zoom-out. | |
| zoomReset() | Programmatically reset the zoom to the global view. | |
| onHover([fn]) | Callback function for mouse hover events. The data node object (or `null` if hovering on background) and the event object are included as arguments `onHover(node, event)`. | |
| onClick([fn]) | Callback function for click events. The data node object (or `null` if clicking on the background) and the event object are included as arguments `onClick(node, event)`. A falsy value (default) automatically zooms on clicked nodes, equivalent to `myChart.onClick(myChart.zoomToNode)`. | |
| onRightClick([fn]) | Callback function for right-click events. The data node object (or `null` if right-clicking on the background) and the event object are included as arguments `onRightClick(node, event)`. A falsy value (default) will fallback to the default browser behaviour, which is to open the context menu. | |
| transitionDuration([number]) | Getter/setter for the animation duration of transitions between states (opening, zoom in/out) in milliseconds. Enter `0` to disable animations. | `800` |
## Data syntax
```js
{
name: "root",
children: [
{
name: "leafA",
value: 3
},
{
name: "nodeB",
children: [
{
name: "leafBA",
value: 5
},
{
name: "leafBB",
value: 1
}
]
}
]
}
```
## Giving Back
[](https://www.paypal.com/cgi-bin/webscr?cmd=_donations&business=L398E7PKP47E8¤cy_code=USD&source=url) If this project has helped you and you'd like to contribute back, you can always [buy me a ☕](https://www.paypal.com/cgi-bin/webscr?cmd=_donations&business=L398E7PKP47E8¤cy_code=USD&source=url)!
[npm-img]: https://img.shields.io/npm/v/treemap-chart
[npm-url]: https://npmjs.org/package/treemap-chart
[build-size-img]: https://img.shields.io/bundlephobia/minzip/treemap-chart
[build-size-url]: https://bundlephobia.com/result?p=treemap-chart
[npm-downloads-img]: https://img.shields.io/npm/dt/treemap-chart
[npm-downloads-url]: https://www.npmtrends.com/treemap-chart