https://github.com/vibtobilab/methurator
methurator is a Python package designed to estimate sequencing saturation for reduced-representation bisulfite sequencing (RRBS) data.
https://github.com/vibtobilab/methurator
methylation rrbs sequencing-saturation
Last synced: 6 months ago
JSON representation
methurator is a Python package designed to estimate sequencing saturation for reduced-representation bisulfite sequencing (RRBS) data.
- Host: GitHub
- URL: https://github.com/vibtobilab/methurator
- Owner: VIBTOBIlab
- License: mit
- Created: 2025-11-02T19:04:39.000Z (9 months ago)
- Default Branch: main
- Last Pushed: 2026-01-22T15:46:07.000Z (6 months ago)
- Last Synced: 2026-01-23T02:19:17.636Z (6 months ago)
- Topics: methylation, rrbs, sequencing-saturation
- Language: Python
- Homepage: https://pypi.org/project/methurator/
- Size: 3.73 MB
- Stars: 0
- Watchers: 0
- Forks: 1
- Open Issues: 0
-
Metadata Files:
- Readme: README.md
- Changelog: CHANGELOG.md
- License: LICENSE
Awesome Lists containing this project
README
# 🧬 methurator
[](https://www.python.org/)
[](LICENSE)
[](https://pytest.org/)
[](https://anaconda.org/bioconda/methurator)
[](https://quay.io/repository/biocontainers/methurator)
**Methurator** is a Python package designed to estimate CpGs saturation for DNA methylation sequencing data.
---
## 📑 Table of Contents
- [1. Dependencies and Notes](#1-dependencies-and-notes)
- [2. Installation](#2-installation)
- [3. Quick Start](#3-quick-start)
- [Option A: Good-Toulmin Estimator](#option-a-good-toulmin-estimator)
- [Option B: Downsample](#option-b-downsample)
- [Step 3 — Plot the sequencing saturation curve](#step-3--plot-the-sequencing-saturation-curve)
- [4. Command Reference](#4-command-reference)
- [`gt-estimator` command](#gt-estimator-command)
- [`downsample` command](#downsample-command)
- [`plot` command](#plot-command)
- [5. Example Workflow](#5-example-workflow)
- [6. How do we compute the sequencing saturation?](#6-how-do-we-compute-the-sequencing-saturation)
---
## 1. Dependencies and Notes
- methurator uses [SAMtools](https://www.htslib.org/) and [MethylDackel](https://github.com/dpryan79/MethylDackel) internally for BAM subsampling, thus they need to be installed.
- When `--genome` is provided, the corresponding FASTA file will be automatically fetched and cached.
- Temporary intermediate files are deleted by default unless `--keep-temporary-files` is specified.
---
## 2. Installation
You can install **methurator** in several ways:
### **Option 1: Install via pip**
```bash
pip install methurator
```
### **Option 2: Install via BioConda**
```bash
conda create -n methurator_env conda::methurator
conda activate methurator_env
```
### **Option 3: Use the BioContainer**
```bash
docker pull quay.io/biocontainers/methurator:0.1.8--pyhdfd78af_0
docker run quay.io/biocontainers/methurator:0.1.8--pyhdfd78af_0 methurator -h
```
---
## 3. Quick Start
### Option A: Good-Toulmin Estimator (best practise)
The `gt-estimator` command performs **Good-Toulmin extrapolation** to estimate sequencing saturation and predict the theoretical number of CpGs at higher depth. This is the recommended approach for extrapolation analysis.
```bash
methurator gt-estimator --fasta tests/data/genome.fa tests/data/Ecoli.csorted.bam
```
This command generates:
- **Summary YAML file** (`methurator_summary.yml`) — Contains metadata, model parameters, and extrapolation results with:
- Extrapolation factor (t) values from 0 to `--t-max` (default: 10.0)
- Boolean indicating interpolated (t ≤ 1) vs extrapolated (t > 1) data
- Total CpGs predicted at each t value
- Confidence intervals (if `--compute_ci` is enabled)
### Option B: Downsample
The `downsample` command performs BAM downsampling according to specified percentages and coverage levels:
```bash
methurator downsample --fasta tests/data/genome.fa tests/data/Ecoli.csorted.bam
```
This command generates:
- **CpG summary** — number of unique CpGs detected in each downsampled BAM
- **Reads summary** — number of reads in each downsampled BAM
- **Summary YAML** — consolidated file with all data and run metadata
### Plot the sequencing saturation curve
Use the `plot` command to visualize the results:
```bash
methurator plot --summary output/methurator_summary.yml
```
---
## 4. Command Reference
### `gt-estimator` command
The **Good-Toulmin estimator** fits an extrapolation model to predict sequencing saturation at infinite depth.
| Argument | Description | Default |
| ------------------------------ | ------------------------------------------------------------------------------------------------------------------ | --------------------- |
| `BAM (positional)` | Path to a single `.bam` file or to multiple ones (e.g. `files/*.bam`). | — |
| `--outdir, -o` | Output directory. | `./output` |
| `--fasta` | Path to the reference genome FASTA file. If not provided, it will be automatically downloaded based on `--genome`. | — |
| `--genome` | Genome used for alignment. Available: `hg19`, `hg38`, `GRCh37`, `GRCh38`, `mm10`, `mm39`. | — |
| `--minimum-coverage`, `-mc` | Minimum CpG coverage to consider. Can be a single integer or a list (e.g. `1,3,5`). | `1` |
| `--t-step` | Step size for extrapolation factor (t) predictions. | `0.05` |
| `--t-max` | Maximum extrapolation factor (t) value. | `10.0` |
| `--compute_ci` | Compute confidence intervals using bootstrap replicates. | `False` |
| `--bootstrap-replicates`, `-b` | Number of bootstrap replicates for CI computation. | `30` |
| `--conf` | Confidence level for bootstrap intervals. | `0.95` |
| `--mu` | Initial mu parameter for negative binomial distribution in EM algorithm. | `0.5` |
| `--size` | Initial size parameter for negative binomial distribution in EM algorithm. | `1.0` |
| `--mt` | Constraint for rational function approximations. | `20` |
| `--rrbs` | If set to True, MethylDackel will use the RRBS flag (--keepDupes). | `False` |
| `--threads`, `-@` | Number of threads to use. | Available threads - 2 |
| `--keep-temporary-files`, `-k` | Keep temporary files after analysis. | `False` |
| `--verbose` | Enable verbose logging. | `False` |
| `--help` , `-h` | Print the help message and exit. | |
| `--version` | Print the package version. | |
---
### `downsample` command
| Option | Description | Default |
| ----------------------------------- | ------------------------------------------------------------------------------------------------------------------ | --------------------- |
| `BAM (positional)` | Path to a single `.bam` file or to multiple ones (e.g. `files/*.bam`). | — |
| `--outdir`, `-o` | Output directory. | `./output` |
| `--fasta` | Path to the reference genome FASTA file. If not provided, it will be automatically downloaded based on `--genome`. | — |
| `--genome` | Genome used for alignment. Available options: `hg19`, `hg38`, `GRCh37`, `GRCh38`, `mm10`, `mm39`. | — |
| `--downsampling-percentages`, `-ds` | Comma-separated list of downsampling percentages between 0 and 1 (exclusive). | `0.1,0.2,0.4,0.6,0.8` |
| `--minimum-coverage`, `-mc` | Minimum CpG coverage to consider for saturation. Can be a single integer or a list (e.g. `1,3,5`). | `3` |
| `--rrbs` | If set, MethylDackel extract will consider the RRBS nature of the data by adding the `--keepDupes` flag. | `False` |
| `--threads`, `-@` | Number of threads to use during downsampling. | All available threads |
| `--keep-temporary-files` | If set, temporary files will be kept after analysis. | `False` |
| `--verbose` | Enable verbose logging. | `False` |
| `--help`, `-h` | Print the help message and exit. | — |
| `--version` | Print the package version. | — |
### `plot` command
| Argument | Description | Default |
| ----------------- | -------------------------------- | ---------- |
| `--summary`, `-s` | Path to the YML summary file. | |
| `--outdir`, `-o` | Output directory. | `./output` |
| `--verbose` | Enable verbose logging. | `False` |
| `--help` , `-h` | Print the help message and exit. | |
| `--version` | Print the package version. | |
---
## 5. Example Workflow
### Using Good-Toulmin Estimator (Recommended)
```bash
# Run Good-Toulmin estimator on BAM file
methurator gt-estimator --genome hg19 my_sample.bam --config_ci
# Generate plots from the results
methurator plot --summary output/methurator_summary.yml
```
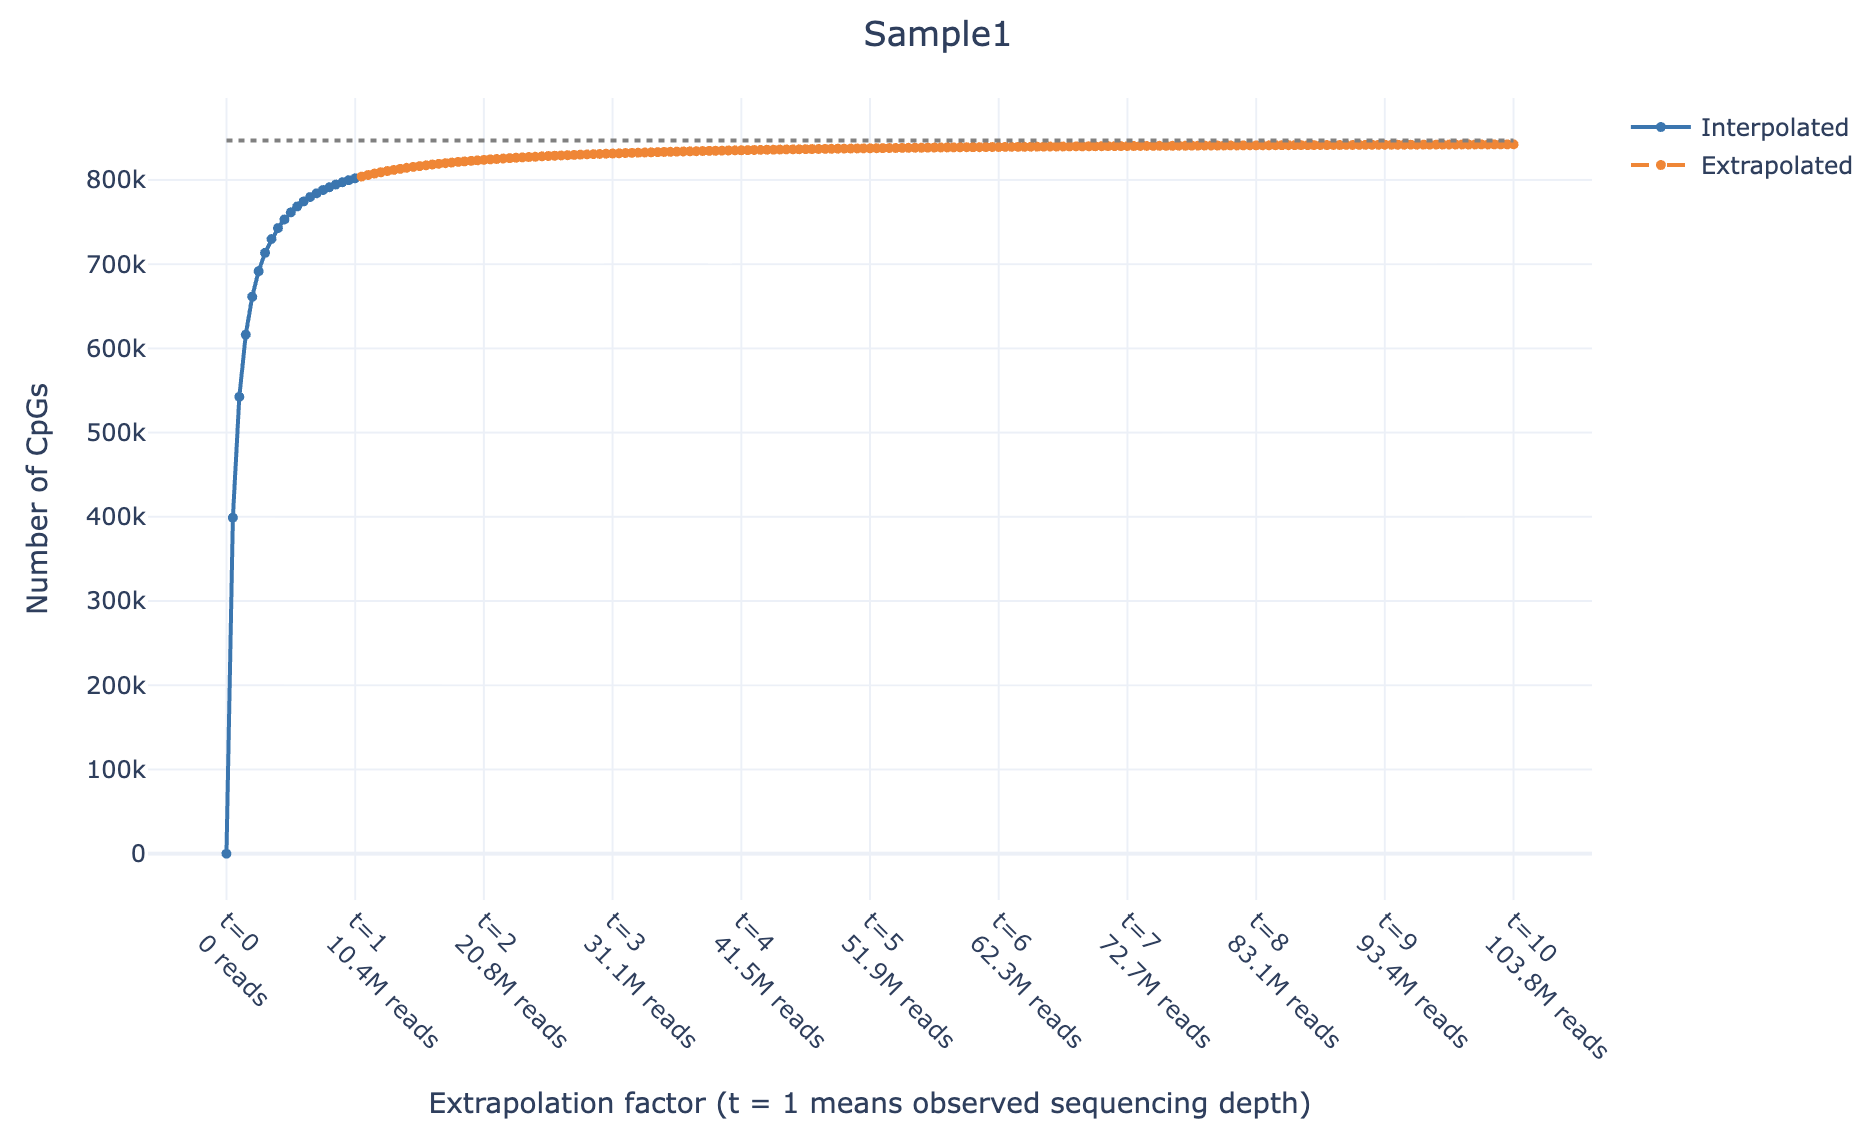
**Example plot preview** (also available as interactive html file [here](https://github.com/VIBTOBIlab/methurator/tree/main/docs/images/example_gt.html)):
### Using Downsample
```bash
# Downsample BAM file
methurator downsample --genome hg19 my_sample.bam
# Generate plots from the results
methurator plot --summary output/methurator_summary.yml
```
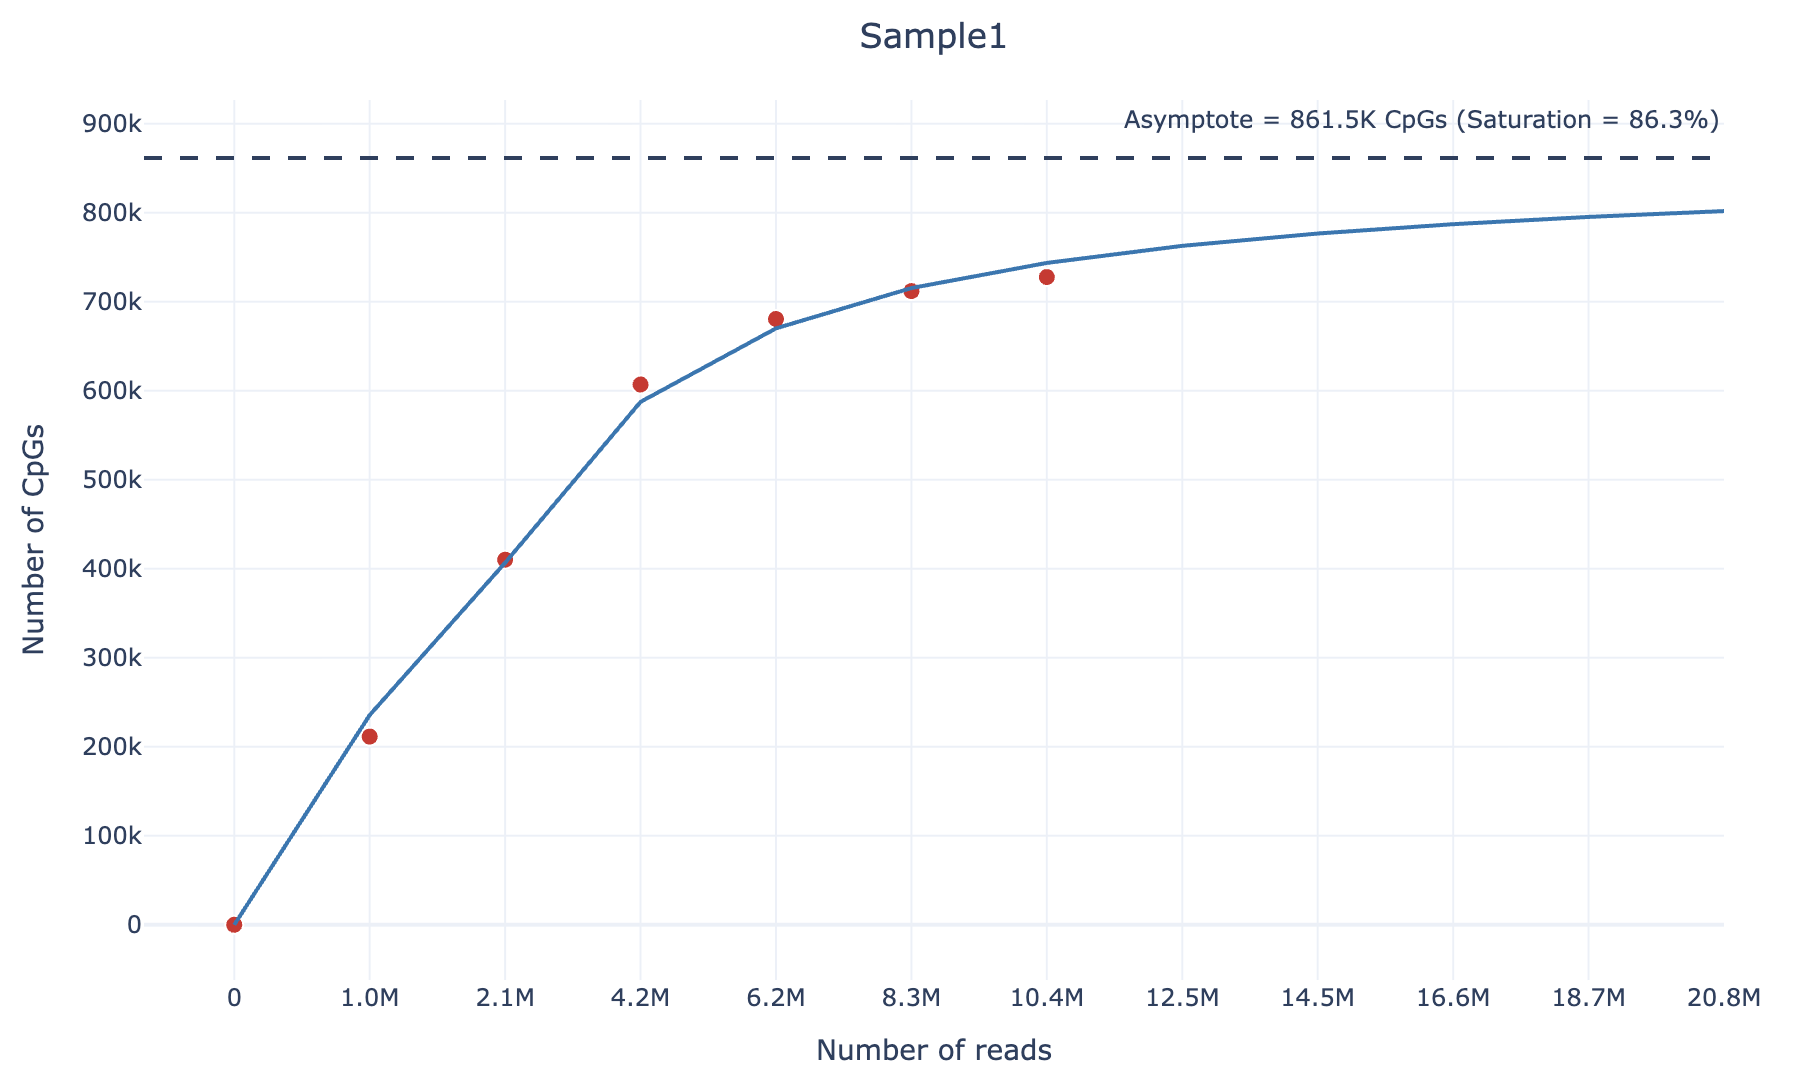
The output plots will be saved in `output/plots/` as interactive HTML files showing the CpG predictions with confidence intervals (if enabled).
**Example plot preview** (also available as interactive html file [here](https://github.com/VIBTOBIlab/methurator/tree/main/docs/images/example.html)):
## 6. How do we compute the sequencing saturation?
### Good-Toulmin Estimator approach (best practise)
**methurator gt-estimator** uses an approach developed in 2018 by [Chao Deng et al](https://arxiv.org/abs/1607.02804) and further implemented in [preseqR](https://github.com/smithlabcode/preseqR). This approach builds on the theoretical nonparametric empirical Bayes foundation of **Good and Toulmin (1956)**, to model sequencing saturation and extrapolate to higher sequencing depths. The model implemented in **preseqR** was mirrored here and tailored toward sequencing saturation application. The workflow consists of the following steps:
1. **Extracts CpGs** from BAM files using MethylDackel
2. **Fits the model implemented by Chao Deng et al** taking in input the observed CpG counts
3. **Predicts future CpG discovery** using rational function approximations
4. **Quantifies confidence intervals** through bootstrap resampling (if enabled)
The extrapolation factor (t) represents the ratio of hypothetical total reads to actual observed reads. Values of t ≤ 1 correspond to **interpolation** (between observed data points), while t > 1 represents **extrapolation** (prediction beyond observed depth).
For a given coverage level:
- At t = 1: prediction matches observed CpGs
- As t increases: predictions approach the theoretical asymptote (maximum CpGs at infinite depth)
### Downsample Approach
To calculate the **sequencing saturation** of an DNAm sample when using the `downsample` command, we adopt the following strategy. For each sample, we downsample it according to 4 different percentages (default: `0.1,0.2,0.4,0.6,0.8`). Then, we compute the number of **unique CpGs covered by at least 3 reads** and the **number of reads** at each downsampling percentage.
We then fit the following curve using the `scipy.optimize.curve_fit` function:
$$
y = \beta_0 \cdot \arctan(\beta_1 \cdot x)
$$
We chose the **arctangent function** because it exhibits an **asymptotic growth** similar to sequencing saturation.
For large values of $\text{x}$ (as $\text{x} \to \infty$), the asymptote corresponds to the theoretical maximum number of **unique CpGs covered by at least 3 reads** and can be computed as:
$$
\text{asymptote} = \beta_0 \cdot \frac{\pi}{2}
$$
Finally, the **sequencing saturation value** can be calculated as following:
$$
\text{Saturation} = \frac{\text{Number of unique CpGs (≥3 counts)}}{\text{Asymptote}}
$$
This approach allows estimation of the theoretical **maximum number of CpGs** that can be detected given an infinite sequencing depth, and quantifies how close the sample is to reaching sequencing saturation.