https://github.com/vikill33/swiftui-contributionchart
A SwiftUI Contribution Chart (GitHub-like) implementation package
https://github.com/vikill33/swiftui-contributionchart
graph ios macos swift swiftui watchos
Last synced: 4 months ago
JSON representation
A SwiftUI Contribution Chart (GitHub-like) implementation package
- Host: GitHub
- URL: https://github.com/vikill33/swiftui-contributionchart
- Owner: VIkill33
- Created: 2022-08-09T03:23:51.000Z (almost 4 years ago)
- Default Branch: main
- Last Pushed: 2024-07-31T09:02:09.000Z (almost 2 years ago)
- Last Synced: 2024-08-01T10:24:53.494Z (almost 2 years ago)
- Topics: graph, ios, macos, swift, swiftui, watchos
- Language: Swift
- Homepage:
- Size: 39.1 KB
- Stars: 104
- Watchers: 3
- Forks: 9
- Open Issues: 2
-
Metadata Files:
- Readme: README.md
Awesome Lists containing this project
README
# ContributionChart
A contribution chart (aka. heatmap, GitHub-like) library for iOS, macOS, and watchOS.
100% written in SwiftUI.


- [It Supports](#it-supports)
* [Custom Block Number](#custom-block-number)
* [Custom Block Color](#custom-block-color)
* [Dark mode](#dark-mode)
- [Installation](#installation)
- [Usage](#usage)
- [Demo Code](#demo-code)
Updates
- 7/31/24 Support input array with any length and add a demo app inside.
# It Supports
## Custom Block Number
Of course, you can also custom the **size** of blocks and **spacing** between blocks.


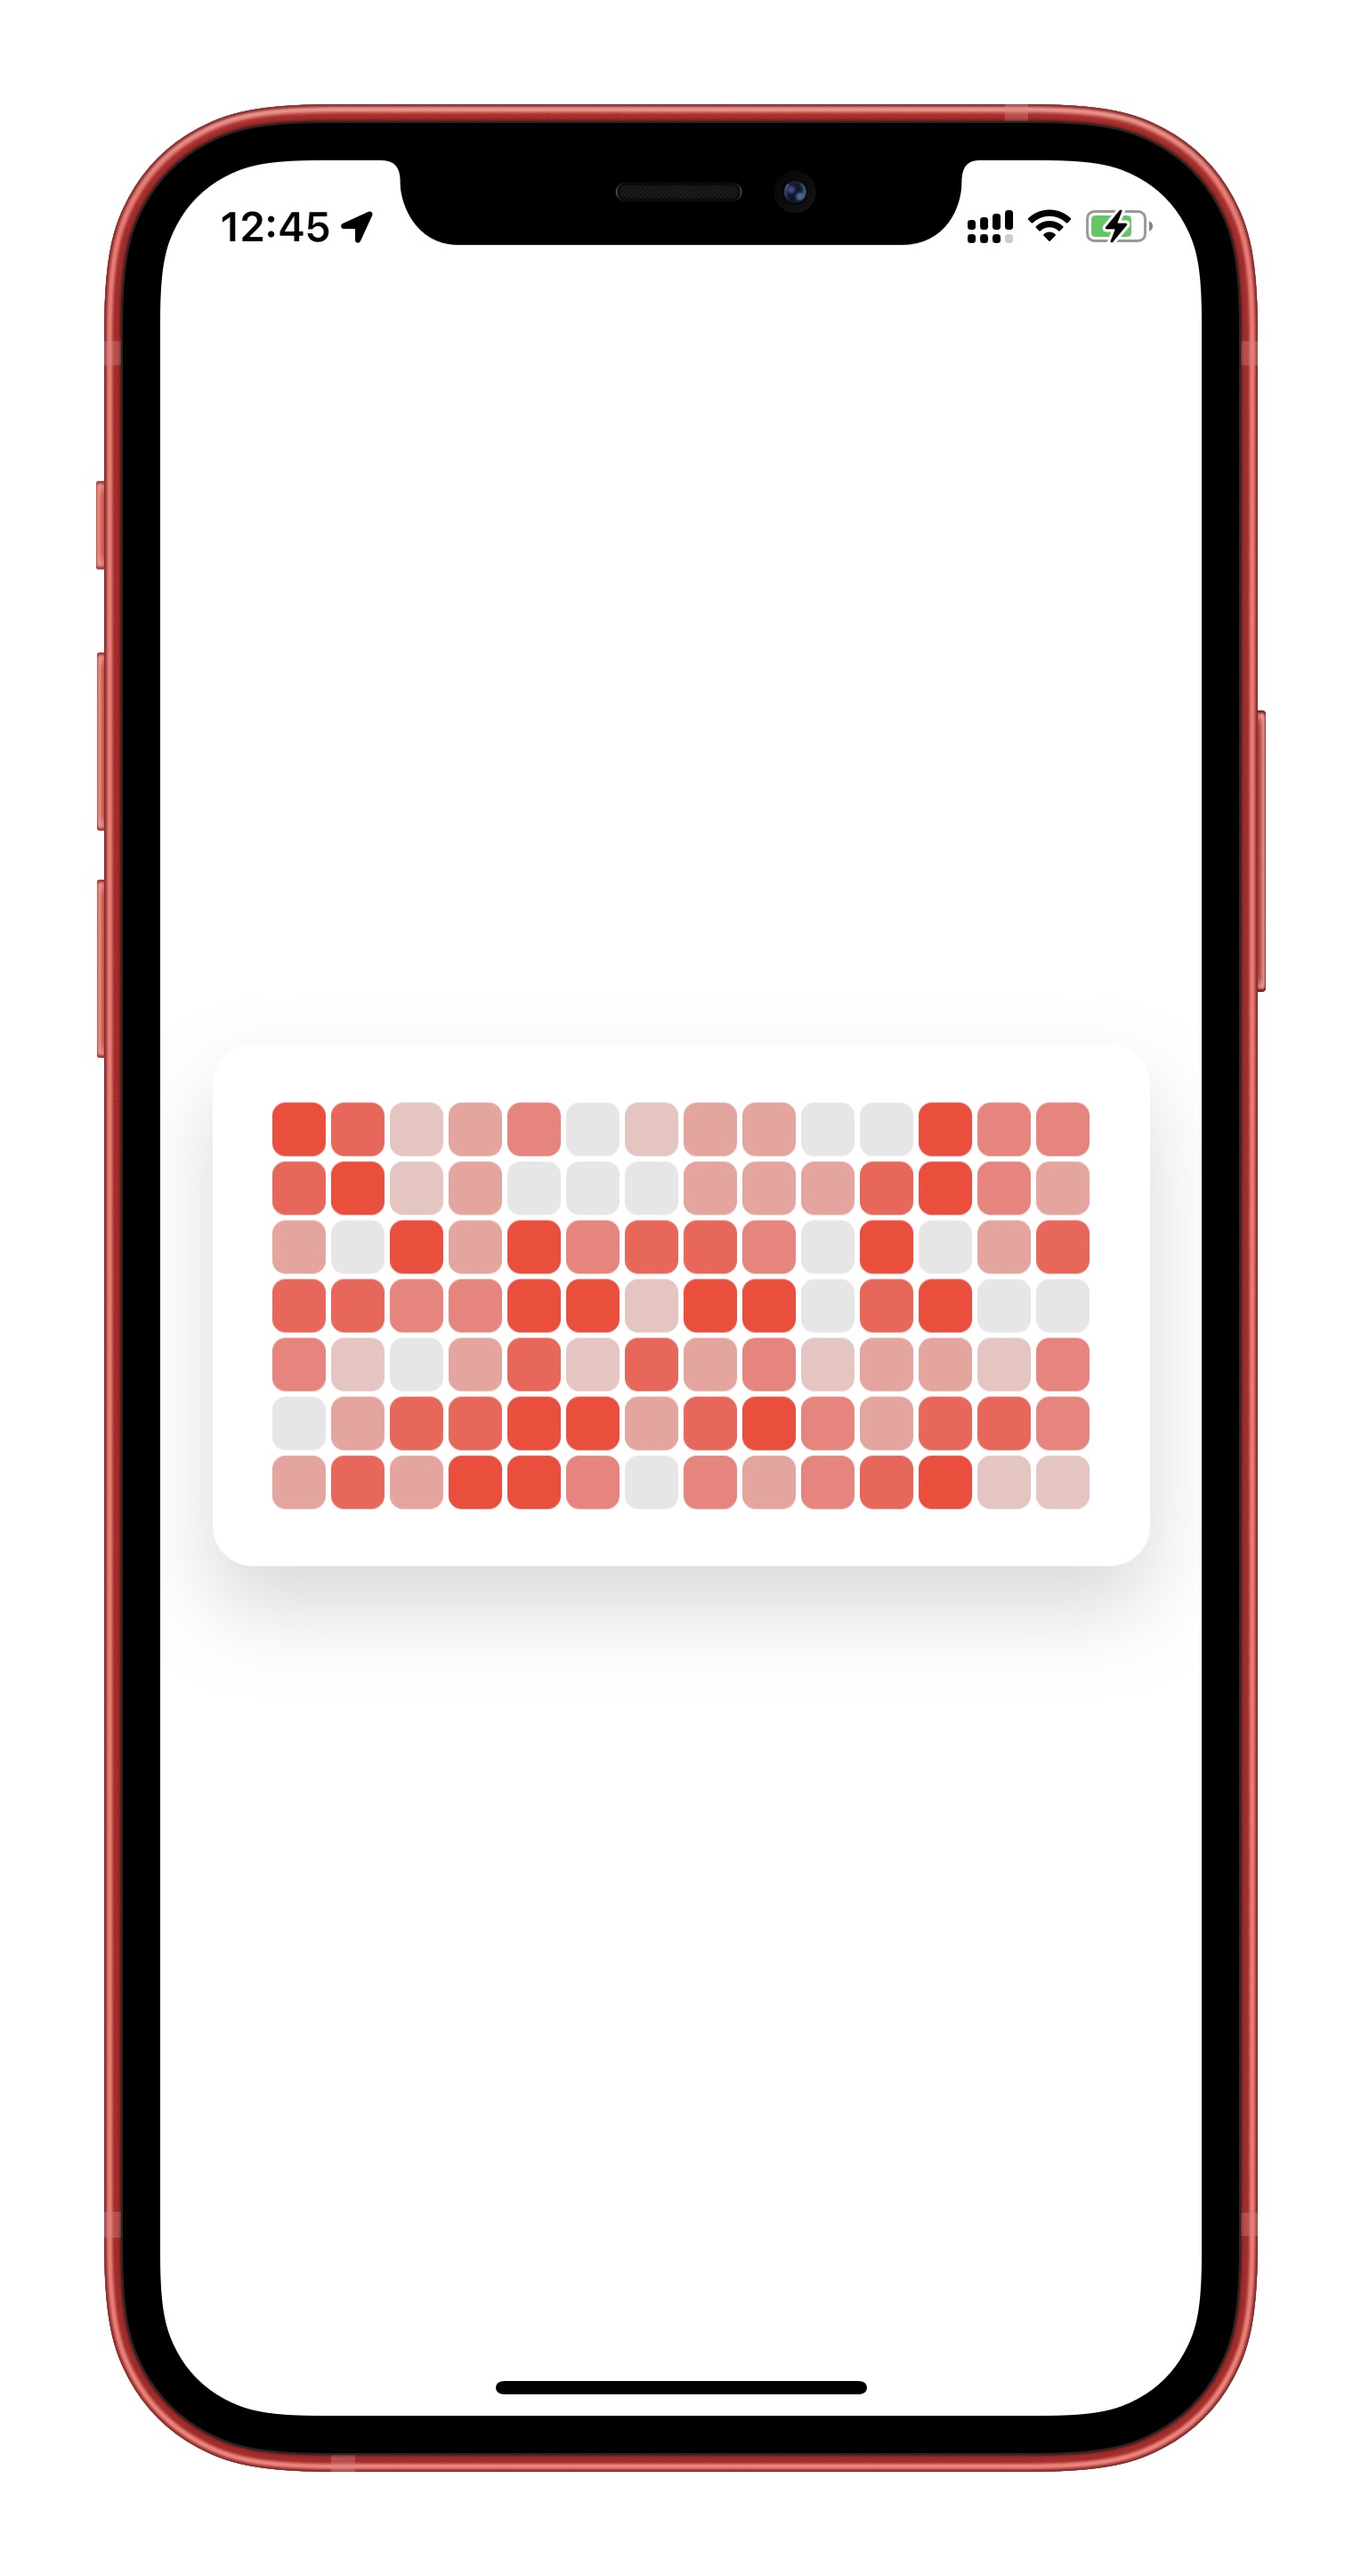
## Custom Block Color
Here are examples using **system colors** as below, and you can custom any color you like.


## Dark mode
Adjust to dark mode color automatically.

# Installation
Require iOS 13, macOS 10.15, watchOS 6 and Xcode 11 or higher.
In Xcode go to `File -> Swift Packages -> Add Package Dependency`
and paste in the repo's url:
`https://github.com/VIkill33/SwiftUI-ContributionChart.git`
Or you can download the code of this repo, then `Add Local...` in Xcode, and open the folder of the repo.
# Usage
- Import this package after you installed by `import ContributionChart`
- Use the chart like
```swift
ContributionChartView(data: yourData,
rows: yourRows,
columns: yourColumns,
targetValue: yourTargetValue,
blockColor: .green)
```
yourData is (**a double array**), and the targetValue is recommanded to set to the max value of the array.
The color of a block will appear as exactly the color as parameter `blockColor` when its value is equal to `targetValue`, and appears light gray when is equal to zero.
The top-Leading block represents the first value in array, while the bottom-trailing represents the last. And the order follows as below:

# Demo Code
```swift
import SwiftUI
import ContributionChart
struct ContentView: View {
var data: [Double]
let rows = 7
let columns = 14
init() {
data = [0.3, 0.4, 0.4, 0.4, 0.1, 0.5, 0.0, 0.1, 0.0, 0.2, 0.2, 0.2, 0.0, 0.2, 0.2, 0.5, 0.4, 0.2, 0.4, 0.5, 0.2, 0.2, 0.4, 0.3, 0.3, 0.2, 0.4, 0.0, 0.0, 0.5, 0.4, 0.3, 0.5, 0.3, 0.0, 0.0, 0.1, 0.0, 0.2, 0.3, 0.0, 0.0, 0.0, 0.5, 0.3, 0.3, 0.0, 0.3, 0.0, 0.5, 0.3, 0.3, 0.4, 0.5, 0.5, 0.3, 0.4, 0.1, 0.4, 0.2, 0.5, 0.1, 0.4, 0.2, 0.5, 0.4, 0.3, 0.5, 0.0, 0.4, 0.3, 0.2, 0.1, 0.5, 0.2, 0.0, 0.2, 0.5, 0.5, 0.3, 0.4, 0.0, 0.3, 0.3, 0.1, 0.2, 0.5, 0.2, 0.1, 0.4, 0.4, 0.0, 0.5, 0.3, 0.3, 0.5, 0.0, 0.2]
}
var body: some View {
ContributionChartView(data: data,
rows: rows,
columns: columns,
targetValue: 0.5,
blockColor: .green)
}
}
struct ContentView_Previews: PreviewProvider {
static var previews: some View {
ContentView()
}
}
```