https://github.com/vinelab/tracing-laravel
Distributed tracing (OpenTracing) for Laravel made easy
https://github.com/vinelab/tracing-laravel
distributed-tracing jaeger laravel opentracing tracing zipkin
Last synced: over 1 year ago
JSON representation
Distributed tracing (OpenTracing) for Laravel made easy
- Host: GitHub
- URL: https://github.com/vinelab/tracing-laravel
- Owner: Vinelab
- License: mit
- Created: 2019-08-09T11:02:13.000Z (almost 7 years ago)
- Default Branch: master
- Last Pushed: 2024-02-05T02:54:52.000Z (over 2 years ago)
- Last Synced: 2025-03-30T06:09:48.392Z (over 1 year ago)
- Topics: distributed-tracing, jaeger, laravel, opentracing, tracing, zipkin
- Language: PHP
- Homepage:
- Size: 153 KB
- Stars: 79
- Watchers: 7
- Forks: 22
- Open Issues: 6
-
Metadata Files:
- Readme: README.md
- License: LICENSE
Awesome Lists containing this project
README
# Laravel Tracing
- [Introduction](#introduction)
- [Requirements](#requirements)
- [Installation](#installation)
- [Driver Prerequisites](#driver-prerequisites)
- [Zipkin](#zipkin)
- [Jaeger](#jaeger)
- [Null](#null)
- [Usage](#usage)
- [Creating Spans](#creating-spans)
- [Customizing Spans](#customizing-spans)
- [Retrieving Spans](#retrieving-spans)
- [Controlling Spans](#controlling-spans)
- [Flushing Spans](#flushing-spans)
- [Logging](#logging)
- [Middleware](#middleware)
- [Console Commands](#console-commands)
- [Queue Jobs](#queue-jobs)
- [Context Propagation](#context-propagation)
- [Custom Drivers](#custom-drivers)
- [Writing New Driver](#writing-new-driver)
- [Registering New Driver](#registering-new-driver)
- [Usage With Lumen](#usage-with-lumen)
- [Integrations](#integrations)
- [Lucid Architecture](#lucid-architecture)
## Introduction
Distributed tracing is the process of tracking the activity resulting from a request to an application. With this feature, you can:
- Trace the path of a request as it travels across a complex system
- Discover the latency of the components (services) along that path
- Know which component in the path is creating a bottleneck
- Inspect payloads that are being sent between components
- Build execution graph for each separate component and more
Simply put, distributed tracing is **a knowledge tool**. One of the most important perks of having it in your project is that deveopers can learn the system by simply following the traces it makes.
See how Uber is using distributed tracing to make sense of large number of microservices and interactions within their product:
[](http://www.youtube.com/watch?v=WRntQsUajow "")
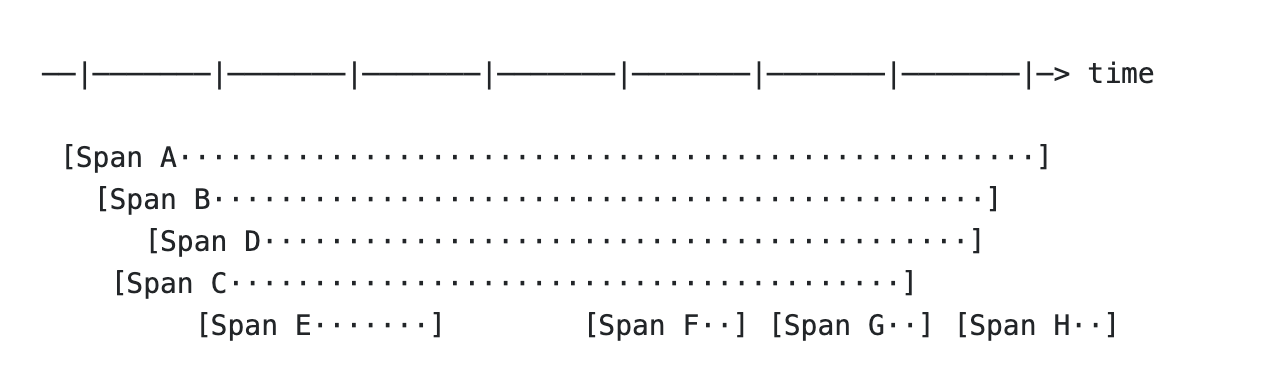
A distributed trace is composed of multiple spans, which represent time spent in services or resources of those services.
Each **Span** has the following:
- Operation name
- Start timestamp
- Finish timestamp
- Set of zero or more key:value tags to enable lookup and record additional information
- Set of zero or more logs paired with a timestamp
- References to related Spans (e.g. a parent)
Spans are typically displayed for your view as a time axis where each span can be unfolded to inpect additional details:
The **Tracer** interface (available via `Trace` facade) creates Spans and understands how to Inject (serialize) and Extract (deserialize) them across process boundaries.
See [OpenTracing spec](https://opentracing.io/specification/) for more details on semantics behind distributed tracing.
## Requirements
This package requires **PHP >= 7.1** and **Laravel 5.5 or later**. We also offer limited Lumen support (basic tracing and http middleware).
## Installation
First, install the package via Composer:
```sh
composer require vinelab/tracing-laravel
```
After installation, you can publish the package configuration using the `vendor:publish` command. This command will publish the `tracing.php` configuration file to your config directory:
```sh
php artisan vendor:publish --provider="Vinelab\Tracing\TracingServiceProvider"
```
You may configure the driver and service name in your `.env` file:
```sh
TRACING_DRIVER=zipkin
TRACING_SERVICE_NAME=orders
```
You should also add credentials for your respective driver as described in the section below.
For Lumen, see [dedicated section](#usage-with-lumen) with installation instructions.
## Driver Prerequisites
### Zipkin
Use the following environment variables to configure Zipkin:
```sh
ZIPKIN_HOST=localhost
ZIPKIN_PORT=9411
```
If the collector is unreachable via a given hostname, you might see debug messages about that printed with each request. If you want to ignore these in production, simply edit your logging configuration to omit `debug` level messages.
### Jaeger
Jaeger is not "officially" supported because of the lack of stable instrumentation for PHP.
However, you can still post spans to Jaeger collector with Zipkin driver using [Zipkin compatible HTTP endpoint](https://www.jaegertracing.io/docs/1.11/features/#backwards-compatibility-with-zipkin). In fact, that's the recommended way to use this library since Jaeger's UI is just that much more convenient than Zipkin's.
There are some downsides, however:
- you won't be able to avail of some Jaeger specific features like contextualized logging since Zipkin only supports tags and time annotations
- HTTP is your only choice of transport (no UDP option)
We'll consider improving Jaeger support once its instrumetation matures.
### Null
The package also includes `null` driver that discards created spans.
## Usage
You will work with tracing via a `Trace` facade provided by this package.
### Creating Spans
Starting new trace is as simple as calling `startSpan` method with name for a logical operation the span represents:
```php
$span = Trace::startSpan('Create Order');
```
Often, you need to continue an existing trace which is why `startSpan` also accepts additional parameter for span context. **SpanContext** may be propagated via various channels including HTTP requests, AMQP messages, arrays or even another span:
```php
$spanContext = Trace::extract($request, Formats::ILLUMINATE_HTTP);
$rootSpan = Trace::startSpan('Create Order', $spanContext);
$childSpan = Trace::startSpan('Validate Order', $rootSpan->getContext())
```
The possibilities are limitless. Refer to [Context Propagation](#context-propagation) section for more details.
### Customizing Spans
Override span name:
```php
$span->setName('Create Order');
```
Add tags, which may be used as lookup keys (to search span on UI) or additional details:
```php
$span->tag('shipping_method', $shipping_method);
```
### Retrieving Spans
You can retrieve the current span, which is also your most recently created span:
```php
$span = Trace::getCurrentSpan()
```
The first span you create when processing a request in the service is called a root span (not to mix with the global root span of the trace):
> After you call [flush](#flushing-spans), the root span is reset.
```php
$span = Trace::getRootSpan()
```
### Controlling Spans
You may finish the span by calling `finish` on it. Span duration is derived by subtracting the start timestamp from this:
```php
$span->finish()
```
You can log additional data between span start and finish. For example, `annotate` creates a time-stamped event to explain latencies:
```php
$span->annotate('Order Validated')
```
## Flushing Spans
Flush refers to the process of sending all pending spans to the transport. It will also reset the state of the tracer including the active spans and UUID:
```php
Trace::flush()
```
Most of the time though you don't need to explicitly call `flush`. Since PHP is designed to die after each request, we already handle finishing the root span and calling flush upon application shutdown for you.
It's only when processing requests continuously in a loop (e.g. AMQP channels) that you must resort to calling `flush` manually.
### Logging
Each root span is associated with a unique identifier that can be used to lookup its trace. It is recommended you include it as part of [context](https://github.com/laravel/framework/blob/v5.8.31/src/Illuminate/Foundation/Exceptions/Handler.php#L151) when reporting errors to bridge the gap between different parts of your monitoring stack:
```php
// Illuminate\Foundation\Exceptions\Handler
/**
* Get the default context variables for logging.
*
* @return array
*/
protected function context()
{
return array_filter([
'userId' => Auth::id(),
'uuid' => Trace::getUUID(),
]);
}
```
[Custom drivers](#custom-drivers) may also support logging structured data (not available in Zipkin) which can be used for integrating tracing with a Log facade:
```php
use Illuminate\Support\Facades\Event;
/**
* Bootstrap any application services.
*
* @return void
*/
public function boot()
{
Event::listen(MessageLogged::class, function (MessageLogged $e) {
Tracer::getCurrentSpan()->log((array) $e);
});
}
```
### Middleware
This package includes a `\Vinelab\Tracing\Middleware\TraceRequests` middleware to take care of continuing the trace from incoming HTTP request.
You should register middleware class in the `$middleware` property of your `app/Http/Kernel.php` class.
The middleware adds the following **tags** on a root span:
- `type` (http)
- `request_method`
- `request_path`
- `request_uri`
- `request_headers`
- `request_ip`
- `request_input`
- `response_status`
- `response_headers`
- `response_content`
> Request and response body are only included for whitelisted content-types. See `logging.content_types` option in your `config/tracing.php`.
You can override the default name of the span (which is `VERB /path/for/route`) in the controller:
```php
Trace::getRootSpan()->setName('Create Order')
```
### Console Commands
> Lumen does not support this feature, but you can still create traces for commands manually using tracer instance.
Let your console commsands be traced by adding `Vinelab\Tracing\Contracts\ShouldBeTraced` interface to your class.
The container span will include the following tags:
- `type` (cli)
- `argv`
The span will be named after the console command. You can override the default name of the span in the command itself:
```php
Trace::getRootSpan()->setName('Mark Orders Expired')
```
### Queue Jobs
> Lumen does not support this feature, but you can still create traces for jobs manually using tracer instance.
Let your queue jobs be traced by adding `Vinelab\Tracing\Contracts\ShouldBeTraced` interface to your job class.
The container span will include the following tags:
- `type` (queue)
- `connection_name` (i.e. sync, redis etc.)
- `queue_name`
- `job_input`
As the name implies, `job_input` allows you to view your job's contructor parameters as JSON. Serialization of objects to this JSON string can be controlled by implementing one of the following interfaces: `Arrayable`, `Jsonable`, `JsonSerializable`, or a `__toString` method. A fallback behavior is to print all your object's public properties.
> Constructor arguments must be saved as a class property with the same name (see ProcessPodcast example below).
The span will be named after the queue job class. You can override the default name of the span in the job itself:
```php
app('tracing.queue.span')->setName('Process Podcast')
```
Note here that the queue span may not necessarily be the root span of the trace. You would usually want the queue to continue the trace from where it left of when the job was dispatched. You can achieve this by simply giving SpanContext to the job's constructor:
```php
class ProcessPodcast implements ShouldQueue
{
use Dispatchable, InteractsWithQueue, Queueable, SerializesModels;
protected $podcast;
protected $spanContext;
public function __construct(Podcast $podcast, SpanContext $spanContext)
{
$this->podcast = $podcast;
$this->spanContext = $spanContext;
}
public function handle(AudioProcessor $processor)
{
// Process uploaded podcast...
}
}
```
The job above can be dispatched like so:
```php
ProcessPodcast::dispatch($podcast, Trace::getRootSpan()->getContext());
```
The rest will be handled automatically. Note that SpanContext will be excluded from logged `job_input`.
**This package doesn't automatically handle tracing of queued closures and queued event listeners.** You can still trace them manually by opening and closing spans. Improving support for these features might be considered for future versions of the package.
### Context Propagation
As we talked about previously, the tracer understands how to inject and extract trace context across different applications (services).
We have already seen the example of extracting trace from HTTP request:
```php
$spanContext = Trace::extract($request, Formats::ILLUMINATE_HTTP);
```
Of course, you don't need to do this manually because this package already includes a [middleware](#middleware) to handle this for you, but the trace may not necessarily come from HTTP request.
The second parameter is a format descriptor that tells us how to deserialize tracing headers from given carrier. By default, the following formats are supported:
```php
use Vinelab\Tracing\Propagation\Formats;
$spanContext = Trace::extract($carrier, Formats::TEXT_MAP);
$spanContext = Trace::extract($carrier, Formats::PSR_REQUEST);
$spanContext = Trace::extract($carrier, Formats::ILLUMINATE_HTTP);
$spanContext = Trace::extract($carrier, Formats::AMQP);
$spanContext = Trace::extract($carrier, Formats::GOOGLE_PUBSUB);
```
You may also add your own format using `registerExtractionFormat` method.
```php
Trace::registerExtractionFormat("pubsub", new PubSubExtractor());
```
The injection format must implement `Vinelab\Tracing\Contracts\Extractor`. Refer to default Zipkin implementation for example.
```php
interface Extractor
{
public function extract($carrier): ?SpanContext;
}
```
Naturally, you can also inject existing trace context from the **current span** into a given carrier so that another service can continue the trace:
```php
$message = Trace::inject($message, Formats::AMQP);
$channel->basic_publish($message, $this->exchangeName, $routingKey);
```
By default, the following formats are supported:
```php
use Vinelab\Tracing\Propagation\Formats;
$carrier = Trace::inject($carrier, Formats::TEXT_MAP);
$carrier = Trace::inject($carrier, Formats::PSR_REQUEST);
$carrier = Trace::inject($carrier, Formats::ILLUMINATE_HTTP);
$carrier = Trace::inject($carrier, Formats::AMQP);
$carrier = Trace::inject($carrier, Formats::GOOGLE_PUBSUB);
$carrier = Trace::inject($carrier, Formats::VINELAB_HTTP);
```
You may also add your own format using `registerInjectionFormat` method.
The injection format must implement `Vinelab\Tracing\Contracts\Injector`. Refer to default Zipkin implementation for example.
```php
interface Injector
{
public function inject(SpanContext $spanContext, &$carrier): void;
}
```
You can also use `injectContext` method if you need to pass span context explicitly:
```php
$carrier = Trace::injectContext($carrier, Formats::TEXT_MAP, $span->getContext());
```
---
**IMPORTANT**: You don't need to create a custom propagation format if you need to get something done quickly. You can always avail of the default `TEXT_MAP` format to inject or extract tracing headers from an associative array.
## Custom Drivers
### Writing New Driver
New drivers must adhere to `Vinelab\Tracing\Contracts\Tracer` contract. Refer to the default ZipkinTracer imlementation for example.
```php
use Vinelab\Tracing\Contracts\Extractor;
use Vinelab\Tracing\Contracts\Injector;
use Vinelab\Tracing\Contracts\Span;
use Vinelab\Tracing\Contracts\SpanContext;
public function startSpan(string $name, SpanContext $spanContext = null, ?int $timestamp = null): Span;
public function getRootSpan(): ?Span;
public function getCurrentSpan(): ?Span;
public function getUUID(): ?string;
public function extract($carrier, string $format): ?SpanContext;
public function inject($carrier, string $format);
public function injectContext($carrier, string $format, SpanContext $spanContext);
public function registerExtractionFormat(string $format, Extractor $extractor): array;
public function registerInjectionFormat(string $format, Injector $injector): array;
public function flush(): void;
```
### Registering New Driver
Once you have written your custom driver, you may register it using the extend method of the `TracingDriverManager`. You should call the `extend` method from the `boot` method of your `AppServiceProvider` or any other service provider used by your application. For example, if you have written a `JaegerTracer`, you may register it like so:
```php
use Vinelab\Tracing\TracingDriverManager;
/**
* Bootstrap any application services.
*
* @return void
*/
public function boot()
{
resolve(TracingDriverManager::class)->extend('jaeger', function () {
return new JaegerTracer;
});
}
```
Once your driver has been registered, you may specify it as your tracing driver in your environment variables:
```
TRACING_DRIVER=jaeger
```
## Usage With Lumen
You need to register service provider manually in `bootstrap/app.php` file:
```php
$app->register(Vinelab\Tracing\TracingServiceProvider::class);
```
You should also register middleware in the same file:
```php
$app->middleware([
Vinelab\Tracing\Middleware\TraceRequests::class,
]);
```
Add the following lines to the end of `public/index.php` file:
```php
$tracer = app(Vinelab\Tracing\Contracts\Tracer::class);
optional($tracer->getRootSpan())->finish();
$tracer->flush();
```
Finally, you may also want to copy over `config/tracing.php` from this repo if you need to customize default settings.
If you don't use facades in your Lumen project, you can resolve tracer instance from container like this:
```php
use Vinelab\Tracing\Contracts\Tracer;
app(Tracer::class)->startSpan('Create Order')
```
Note that Lumen currently doesn't support automatic tracing for console commands and jobs because it doesn't dispatch some events and terminating callbacks. However, you can still create traces manually where you need them.
## Integrations
### Lucid Architecture
This package includes optional `Vinelab\Tracing\Integration\Concerns\TracesLucidArchitecture` trait to enable tracing for [Lucid projects](https://github.com/lucid-architecture/laravel-microservice):
```php
class TracingServiceProvider extends ServiceProvider
{
use TracesLucidArchitecture;
/**
* Bootstrap any application services.
*
* @return void
*/
public function boot()
{
$this->traceLucidArchitecture();
}
}
```