https://github.com/viragtripathi/crdb-sql-audit
CLI tool to extract, deduplicate, and analyze SQL logs for CockroachDB compatibility
https://github.com/viragtripathi/crdb-sql-audit
cockroach cockroach-cloud cockroach-database cockroachdb postgres postgresql
Last synced: 6 months ago
JSON representation
CLI tool to extract, deduplicate, and analyze SQL logs for CockroachDB compatibility
- Host: GitHub
- URL: https://github.com/viragtripathi/crdb-sql-audit
- Owner: viragtripathi
- License: mit
- Created: 2025-05-15T02:19:52.000Z (about 1 year ago)
- Default Branch: main
- Last Pushed: 2025-05-21T17:25:47.000Z (about 1 year ago)
- Last Synced: 2026-01-07T03:44:02.199Z (6 months ago)
- Topics: cockroach, cockroach-cloud, cockroach-database, cockroachdb, postgres, postgresql
- Language: Python
- Homepage:
- Size: 1.32 MB
- Stars: 1
- Watchers: 1
- Forks: 0
- Open Issues: 0
-
Metadata Files:
- Readme: README.md
- License: LICENSE
Awesome Lists containing this project
README
[](https://pypi.org/project/crdb-sql-audit/)
[](https://pypi.org/project/crdb-sql-audit/)
[](https://pypi.org/project/crdb-sql-audit/)
[](https://github.com/viragtripathi/crdb-sql-audit/actions)
[](https://github.com/codespaces/new?repo=viragtripathi/crdb-sql-audit&machine=standardLinux32gb&devcontainer_path=.devcontainer%2Fdevcontainer.json)
# crdb-sql-audit
A powerful CLI tool to extract, deduplicate, and analyze SQL logs for **CockroachDB compatibility** using a flexible, rule-based engine.
## 🚀 Features
- Works with **any SQL dialect** (PostgreSQL, MySQL, Oracle, etc.)
- Extracts SQL and function calls using customizable search terms (e.g. `execute`, `pg_`)
- Deduplicates repeated SQL statements from logs
- Analyzes SQL using a **YAML-based rule engine**
- Supports default compatibility rules (PostgreSQL ➜ CockroachDB)
- Allows **custom rule sets** via `--rules`
- Logs analysis output to both terminal and `crdb_sql_audit.log`
- Automatically detects SQL statement types (e.g. SELECT, DELETE)
- Friendly CLI with `--help` and `--version`
- Export full reports in multiple formats:
- `.sql`: Deduplicated queries
- `.csv`: Raw compatibility issue list
- `.md`: Developer-friendly Markdown report
- `.html`: Interactive browser report with sorting/filtering
- `.png`: Visual bar chart of issues
## 🖼 Sample Output
| Report Type | Preview |
|-------------|-----------------------------------------------------------------------------------------------------------------------|
| HTML | 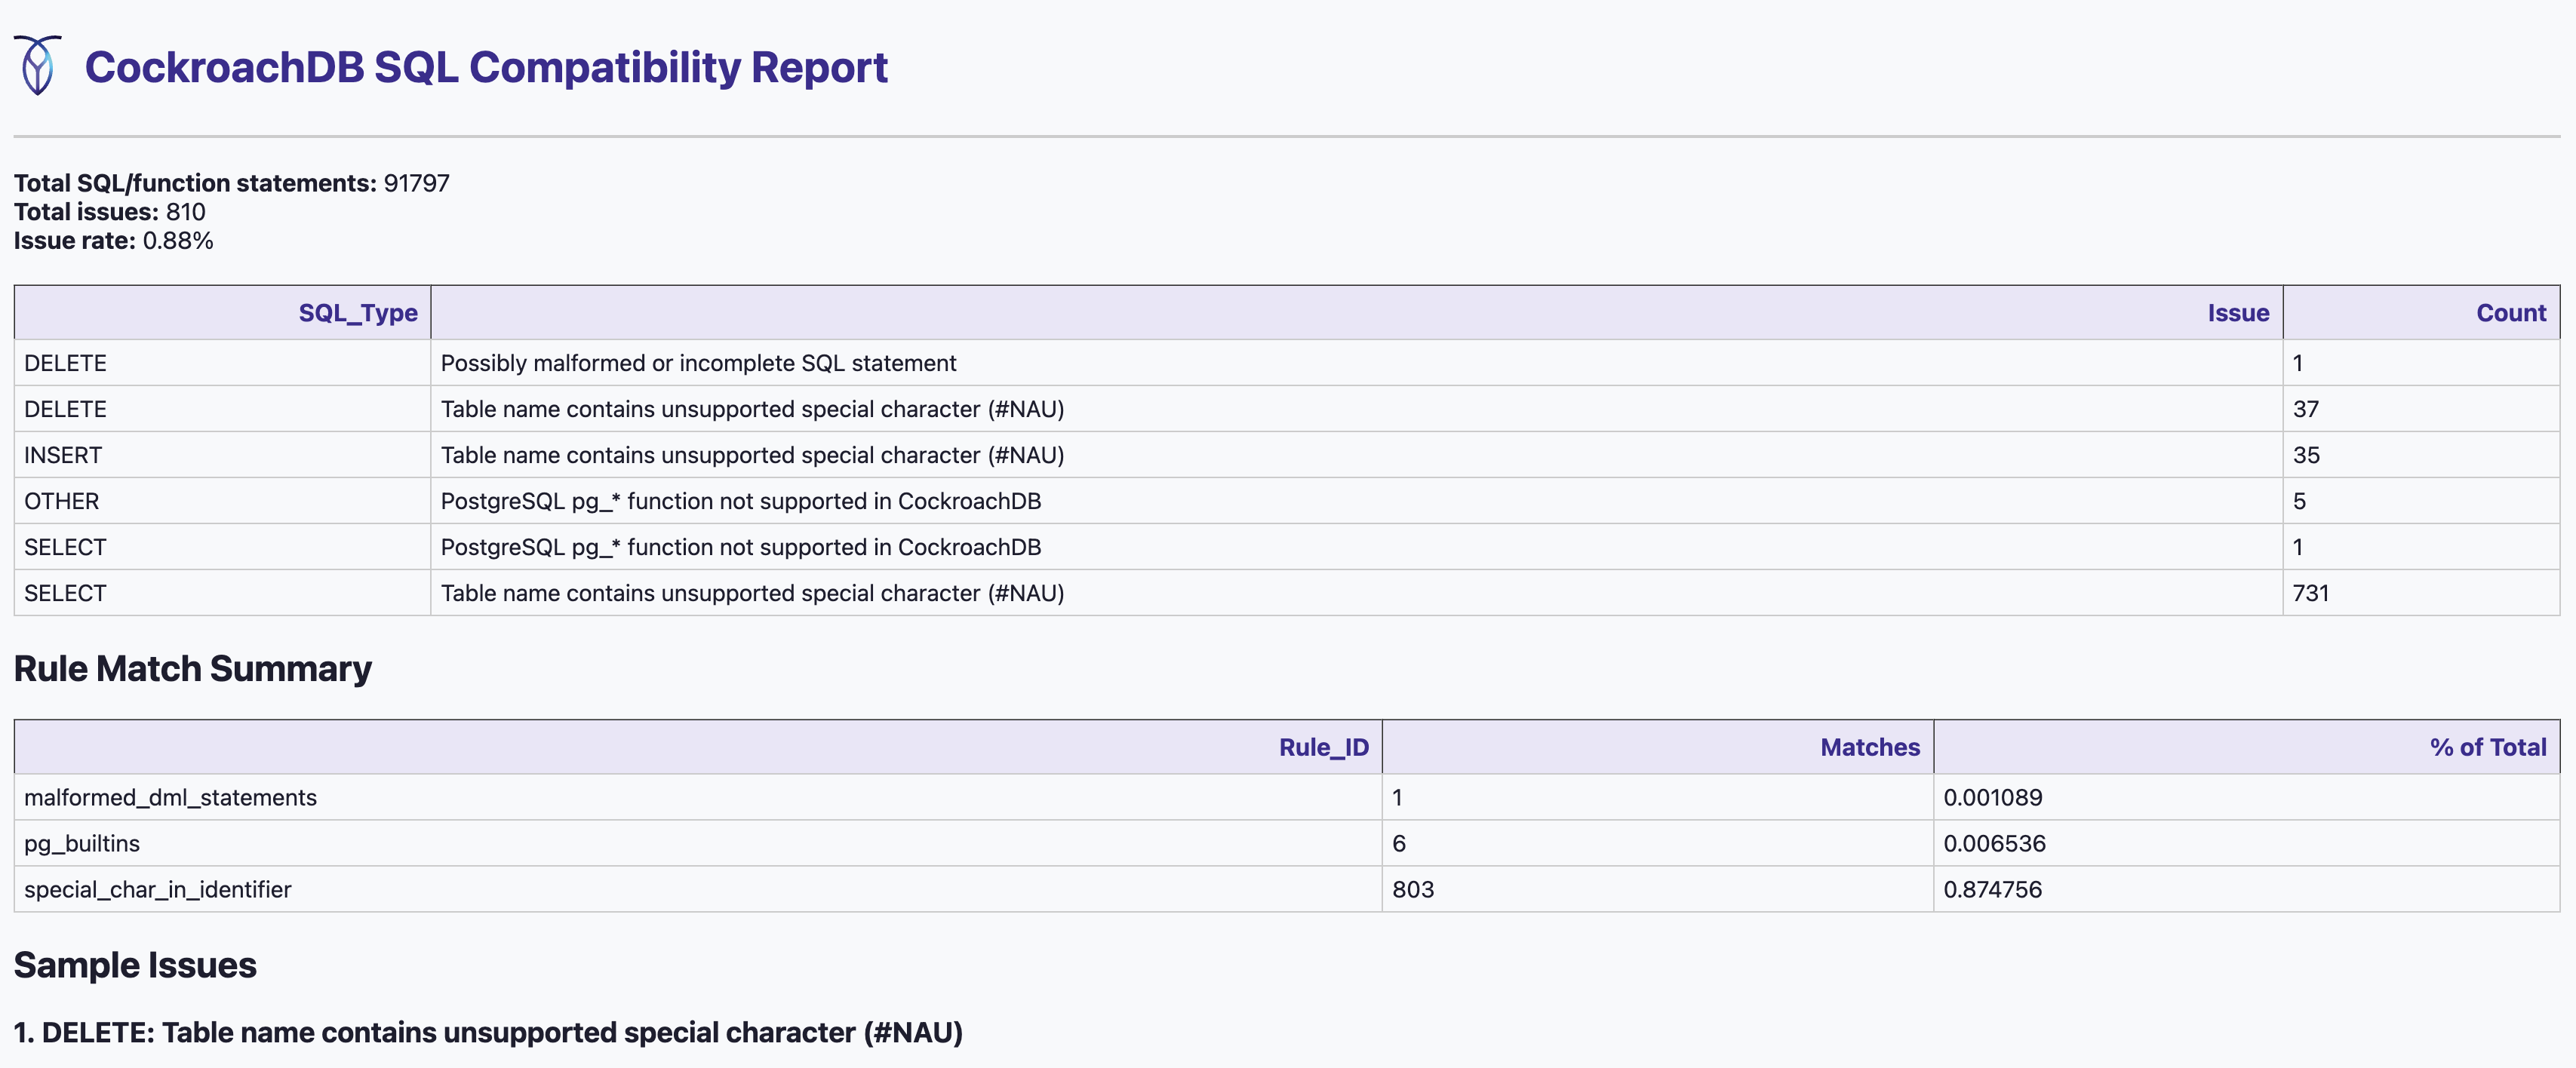 |
| Chart | 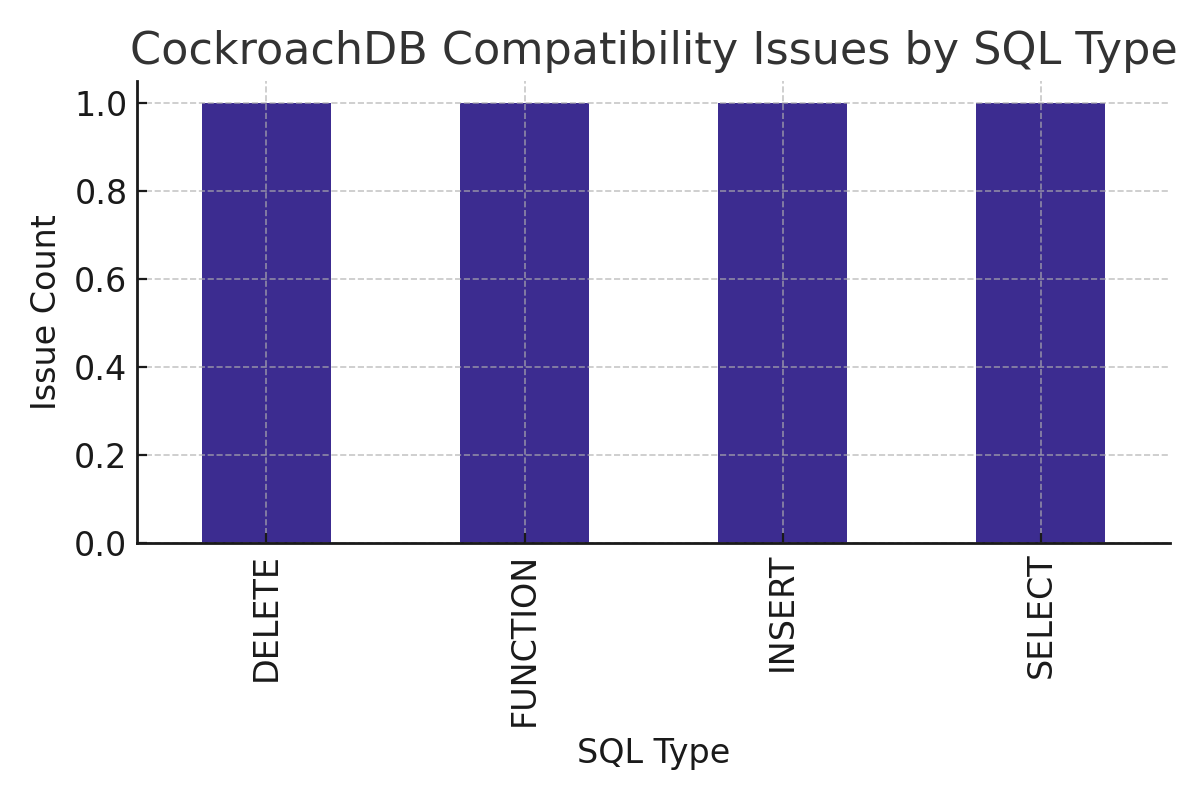 |
| CSV | 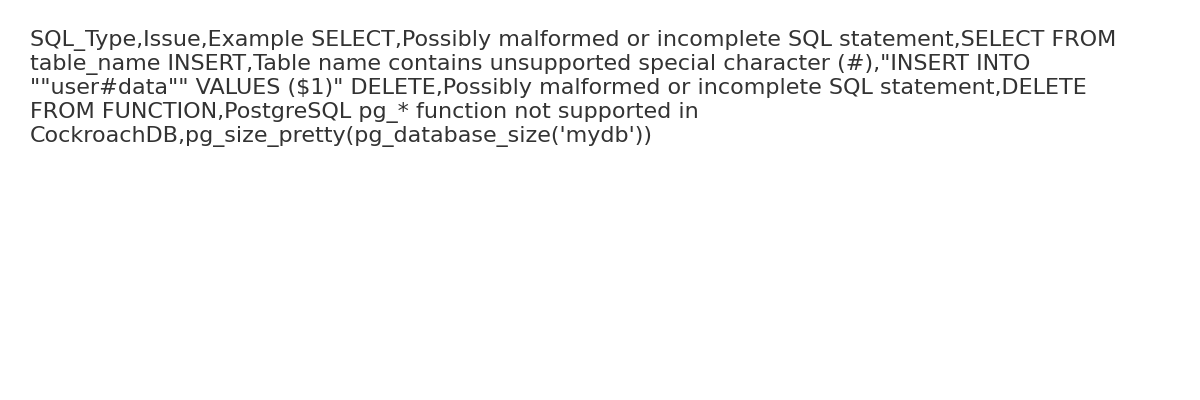 |
| SQL | 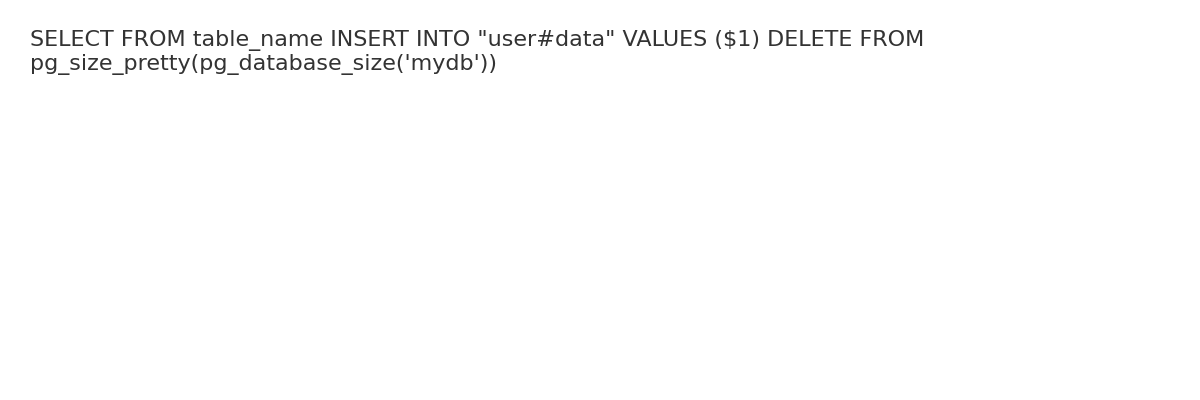 |
| Markdown | 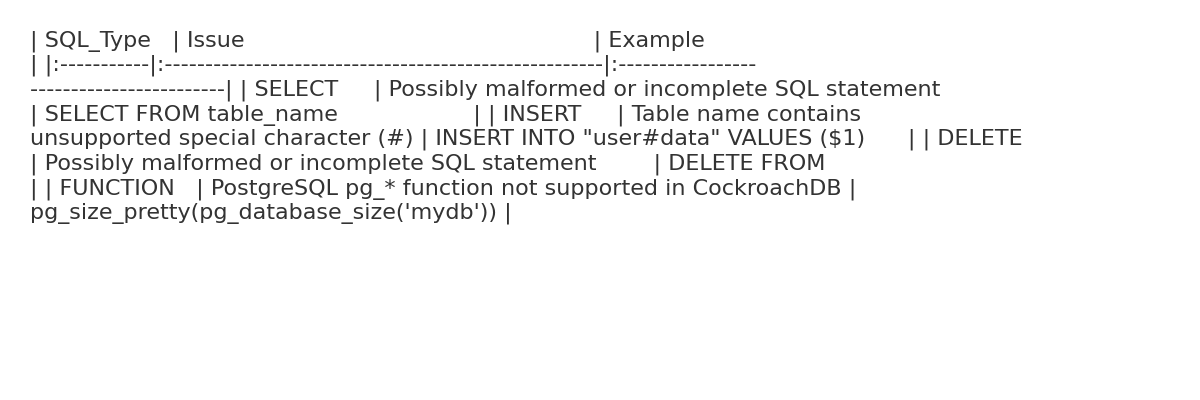 |
## 📦 Installation
### Option A: Quick Install from PyPI
```bash
pip install crdb-sql-audit
```
### Option B: Local Dev Install
```bash
git clone https://github.com/your-org/crdb-sql-audit.git
cd crdb-sql-audit
python -m venv venv
source venv/bin/activate
pip install .
```
### Option C: Build via `pyproject.toml`
```bash
python -m build
pip install dist/crdb_sql_audit-0.2.0-py3-none-any.whl
```
## 🧪 Usage
```bash
crdb-sql-audit \
--dir /path/to/logs \
--filters execute,pg_ \
--out output/report
```
You can also analyze a single file:
```bash
crdb-sql-audit \
--file /path/to/logfile.log \
--filters SELECT,INSERT \
--raw \
--out output/single_file_report
```
> ⚠️ You must provide either `--dir` or `--file`, but not both.
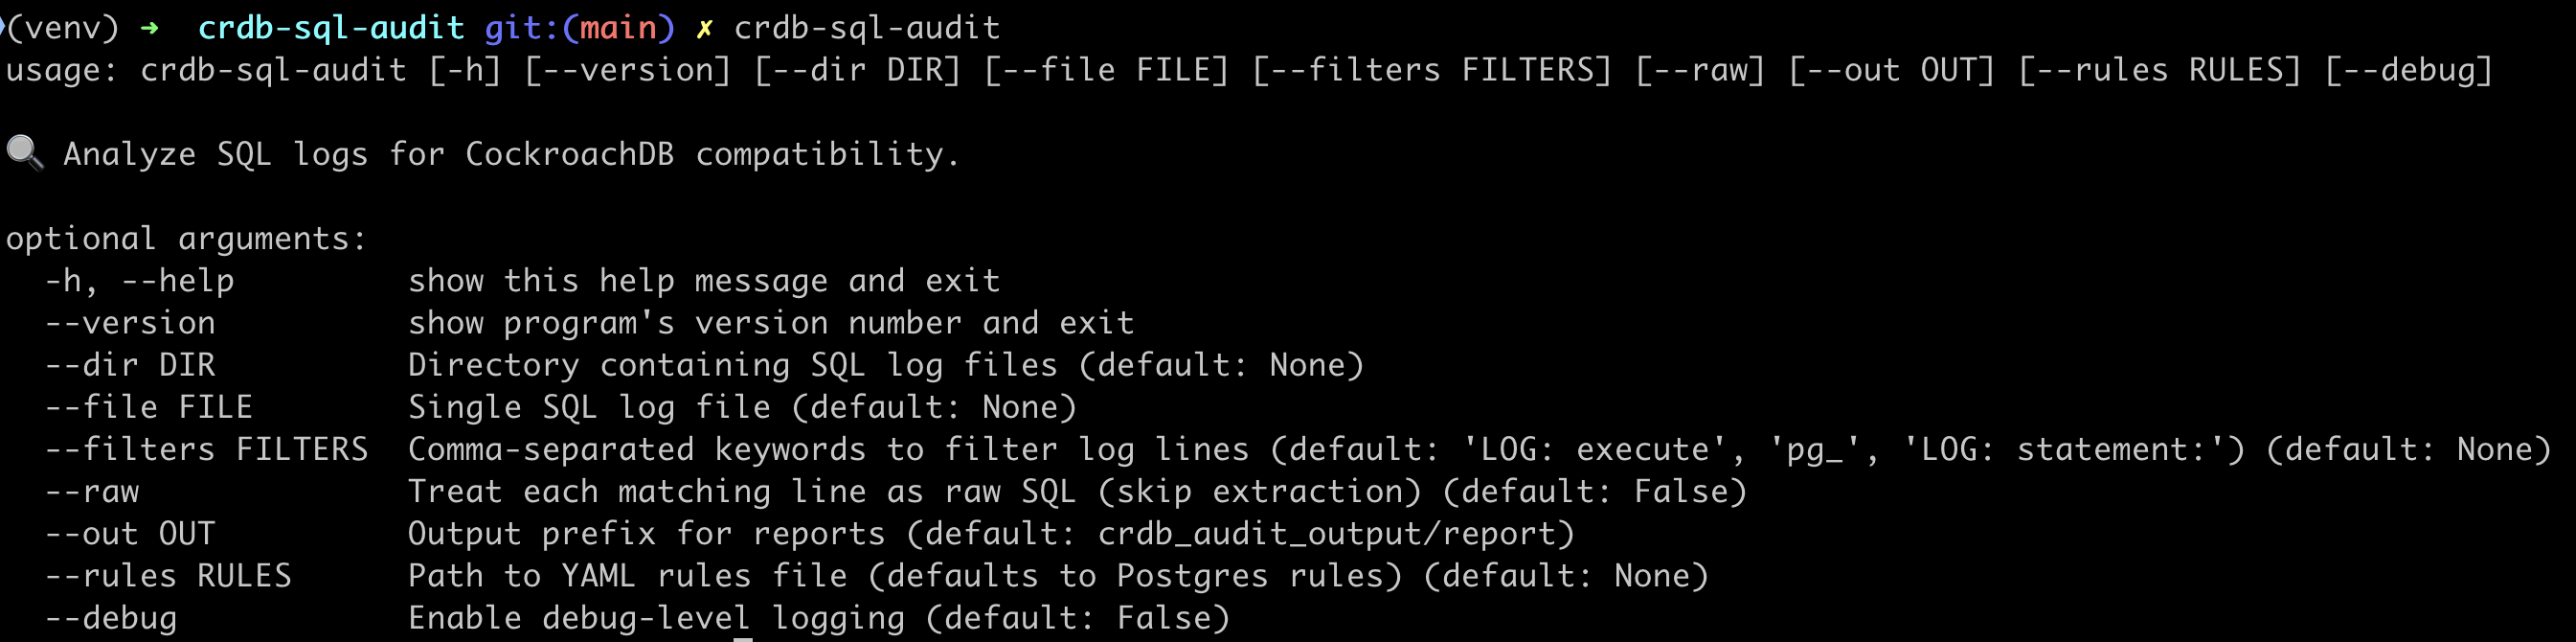
### 🔧 Additional Options
```bash
--dir Directory containing SQL log files (mutually exclusive with --file)
--file Single SQL log file (mutually exclusive with --dir)
--filters Comma-separated search keywords to extract SQL (default: 'LOG: execute', 'pg_', 'LOG: statement:')
--raw Treat each matching line as a raw SQL statement (default: False)
--rules Path to YAML rules file (optional, default: built-in PostgreSQL rules)
--out Output file prefix (default: crdb_audit_output/report)
--debug Enable debug-level logging
--help Show usage help
--version Show current version
```
### 📘 CLI Help Example
```bash
crdb-sql-audit --help
```
### Custom Rules Example
```bash
crdb-sql-audit \
--dir ./logs \
--filters execute,pg_ \
--rules ./rules/mysql_to_crdb.yaml \
--out output/mysql_report
```
> 💡 This tool supports auditing **any SQL dialect** — just provide a rule set for your source database (e.g., PostgreSQL, MySQL, Oracle).
## 📁 Output
```
output/
├── report.sql # Deduplicated SQL
├── report.csv # Compatibility issues
├── report.md # Markdown summary
├── report.html # Interactive dashboard
├── report_chart.png # Visual chart of issues
├── crdb_sql_audit.log # Full run log
```
## 🧹 Preparing Your Log Files
To analyze SQL logs effectively, we recommend the following preprocessing steps:
### 1. Extract SQL-related Lines
```bash
grep "execute" app.log > sql_only.log
# or to include pg_ built-in function usage:
grep -E "execute|pg_" app.log > sql_only.log
```
### 2. Split Into Manageable Chunks (Optional but Recommended)
```bash
split -b 50M sql_only.log chunks/sql_chunk_
```
### 3. Run the Audit
```bash
crdb-sql-audit --dir chunks --filters execute,pg_ --out output/report
```
### 🗜 Supported Log Formats
This tool automatically supports reading:
* ✅ Regular `.log` or `.txt` files
* ✅ Compressed files: `.gz`, `.xz`
* ✅ Folders with mixed log formats
You can pass these directly using `--file` or `--dir`:
```bash
crdb-sql-audit --file logs/app.log.gz --out output/report_from_gz
```
### 🧪 Raw Mode vs. Filtered Mode
This tool supports two modes of SQL log analysis:
| Mode | Behavior |
|-----------------------|-------------------------------------------------------------------------|
| `--filters` (default) | Filters log lines using keywords like `LOG: execute`, `pg_`, etc. |
| `--raw` | Analyzes every line as a potential SQL statement — no filtering applied |
> ✅ Use `--raw` if you want the most complete coverage, especially for mixed-format or unknown logs.
> ⚠️ Warning: large logs + `--raw` + `--debug` may generate gigabytes of audit output.
## 📚 Rule Engine Format
Rules are written in YAML and matched against each SQL line. Example:
> 💡 This is also the default rule if you don't provide `--rules` param.
```yaml
# postgres_to_crdb.yaml — Comprehensive CRDB Compatibility Rules based on https://www.cockroachlabs.com/docs/v25.2/sql-feature-support
- id: malformed_dml_statements
match: '^(SELECT|INSERT|UPDATE|DELETE FROM)\s*$'
message: "Possibly malformed or incomplete SQL statement"
level: warning
tags: [syntax]
- id: special_char_in_identifier
match: '"[^\"]*#\w*"'
message: "Table name contains unsupported special character (#)"
level: error
tags: [table, identifier]
- id: pg_builtins
match: '^.*\bpg_\w+\s*\(.*$'
message: "PostgreSQL pg_* function not supported in CockroachDB"
level: error
tags: [function]
- id: with_cte
match: '^\s*WITH\s+'
message: "CTE (WITH clause) detected"
level: warning
tags: [cte, syntax]
- id: upsert_syntax
match: '^\s*UPSERT\s+'
message: "UPSERT syntax (CockroachDB supports but should be reviewed)"
level: info
tags: [upsert, insert]
- id: json_ops
match: '->|->>|::json[b]?' # Look for JSON navigation or cast
message: "JSON/JSONB usage detected"
level: info
tags: [json]
- id: row_values
match: '\(.*\).*IN\s*\(' # e.g., WHERE (a, b) IN ((1, 2))
message: "ROW VALUES in IN clause"
level: warning
tags: [rowvalues, comparison]
- id: window_function
match: '\bOVER\s*\('
message: "Window function usage (e.g., RANK, ROW_NUMBER)"
level: info
tags: [window, analytics]
- id: set_ops
match: '\s+(UNION|INTERSECT|EXCEPT)\s+'
message: "Set operation (UNION, INTERSECT, EXCEPT)"
level: info
tags: [setops]
- id: case_expr
match: '\bCASE\b.*\bWHEN\b.*\bTHEN\b'
message: "CASE expression detected"
level: info
tags: [case, conditional]
- id: time_interval
match: 'INTERVAL\s+[''\"]'
message: "TIME INTERVAL expression"
level: info
tags: [interval, time]
- id: group_by_rollup
match: 'GROUP BY ROLLUP\('
message: "ROLLUP clause used"
level: warning
tags: [aggregation, rollup]
- id: filter_clause
match: 'FILTER\s*\(\s*WHERE'
message: "FILTER clause used in aggregation"
level: warning
tags: [aggregation, filter]
```
> 📦 Multiple rule sets can be created to target different SQL dialects (e.g., `postgres_to_crdb.yaml`, `mysql_to_crdb.yaml`, etc.)
## 🧪 Validate Your Regex Rules
### 🔍 Online (Recommended)
Use [regex101.com](https://regex101.com/?flavor=python) to test your patterns:
- Set the **flavor to Python**
- Paste your rule into the regex field
- Paste a sample SQL line into the test area
### 🐍 In Python
You can also test your rules directly:
```python
import re
pattern = re.compile(r'^.*\bpg_\w+\s*\(.*$', re.IGNORECASE)
sql = "SELECT pg_backend_pid()"
print(bool(pattern.search(sql))) # ✅ True
```
### 🛠 Validate with Shell
You can use basic Unix commands to check for patterns like pg_ functions directly in your log chunks:
| Task | Command |
|------------------------------------|---------------------------------------------------------------------------|
| Total matches across chunks | `grep -oE '\bpg_[a-zA-Z0-9_]+\(' chunks/* \| wc -l` |
| Unique function names | `grep -oE '\bpg_[a-zA-Z0-9_]+\(' chunks/* \| sort \| uniq` |
| Count occurrences of each function | `grep -oE '\bpg_[a-zA-Z0-9_]+\(' chunks/* \| sort \| uniq -c \| sort -nr` |
| Full SQL lines containing pg\_\* | `grep -E '\bpg_[a-zA-Z0-9_]+\(' chunks/*` |
Also, before or after running `crdb-sql-audit`, you can inspect your logs to see how often common filters appear.
For example, to count usage of PostgreSQL built-ins and log patterns:
```bash
{
echo "🔍 pg_* function usage:"
grep -oE '\bpg_[a-zA-Z0-9_]+\(' chunks/* | sort | uniq -c | sort -nr
echo ""
echo "🔍 PostgreSQL LOG prefixes:"
grep -oE 'LOG: execute|LOG: statement:|LOG: duration:' chunks/* | sort | uniq -c | sort -nr
}
````
This will show counts of:
* Each `pg_` function used (e.g. `pg_backend_pid(`)
* Number of log lines using `LOG: execute`, `LOG: statement:`, and `LOG: duration:`
> ✅ Useful for checking whether your filters (`--filters`) are likely to match anything in the input.
---
## 🧪 Running Tests
This project includes a test suite using sample logs and rules to validate behavior.
### 🔧 To run locally:
```bash
python tests/test_runner.py
```
### 🧪 What it does:
* Runs `crdb-sql-audit` on a small sample of PostgreSQL-style logs
* Uses `tests/rules/test_rules.yaml`
* Verifies that a CSV report is created with expected issues
✅ This runs automatically in GitHub Actions on every commit to `main`.
---
📓 [Try it in a Jupyter notebook](notebooks/demo_crdb_sql_audit.ipynb)