https://github.com/vitalibo/dashing-prometheus-widget
Simple Dashing widget for displaying Prometheus graphs
https://github.com/vitalibo/dashing-prometheus-widget
dashing prometheus
Last synced: 4 months ago
JSON representation
Simple Dashing widget for displaying Prometheus graphs
- Host: GitHub
- URL: https://github.com/vitalibo/dashing-prometheus-widget
- Owner: vitalibo
- Created: 2017-04-12T19:28:51.000Z (about 9 years ago)
- Default Branch: master
- Last Pushed: 2017-04-14T06:57:07.000Z (about 9 years ago)
- Last Synced: 2025-08-30T09:35:09.701Z (10 months ago)
- Topics: dashing, prometheus
- Language: Ruby
- Homepage:
- Size: 56.6 KB
- Stars: 5
- Watchers: 2
- Forks: 0
- Open Issues: 0
-
Metadata Files:
- Readme: README.md
Awesome Lists containing this project
README
## Dashing-Prometheus-Widget
This widget is for Shopify's dashing framework to display graphs of Prometheus monitoring system.
### Preview
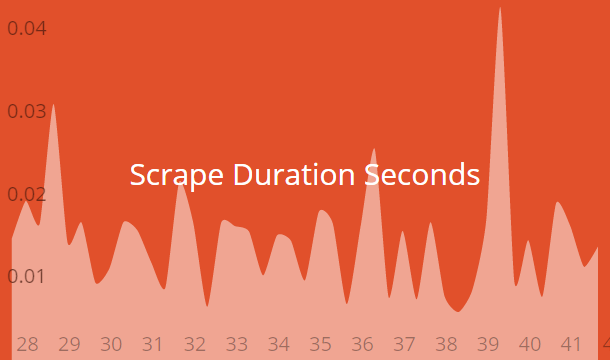
### Usage
To install this widget in your dashboard, please copy all files from folder `src` to your dashing installation.
Now your dashboard available at `http://:3030/prometheus`.
### Configuration
Insert the HTML code in your erb file like this :
```
```
also you can you `Graph` as `data-view`
To configure Prometheus job, you need set `host` and `port` in creating, see following code :
```
prometheus = Prometheus.new(
{
:host => 'prometheus',
:port => 9090
})
```
Invoke method `query_range` required parameters:
- `query=` - Prometheus expression query string
- `step=` - Query resolution step width.
- `start=` - Start timestamp.
- `end=` - End timestamp.
```
prometheus.query_range(
'scrape_duration_seconds',
'20s')
```
And return array of pairs, example: `{"x":1234567890,"y":1.23}`, where `x` - timestamp, `y` - value
### Links
- [Dashing](http://dashing.io/)
- [Prometheus. HTTP API](https://prometheus.io/docs/querying/api/)