https://github.com/vivekchand/clawmetry
See your agent think. Real-time observability dashboard for OpenClaw AI agents.
https://github.com/vivekchand/clawmetry
ai-agent clawmetry dashboard monitoring observability openclaw opentelemetry python
Last synced: about 2 months ago
JSON representation
See your agent think. Real-time observability dashboard for OpenClaw AI agents.
- Host: GitHub
- URL: https://github.com/vivekchand/clawmetry
- Owner: vivekchand
- License: mit
- Created: 2026-02-13T06:49:19.000Z (5 months ago)
- Default Branch: main
- Last Pushed: 2026-05-28T09:25:04.000Z (about 2 months ago)
- Last Synced: 2026-05-28T09:25:10.806Z (about 2 months ago)
- Topics: ai-agent, clawmetry, dashboard, monitoring, observability, openclaw, opentelemetry, python
- Language: Python
- Homepage: https://clawmetry.com
- Size: 2.29 GB
- Stars: 353
- Watchers: 6
- Forks: 55
- Open Issues: 83
-
Metadata Files:
- Readme: README.md
- Changelog: CHANGELOG.md
- Contributing: CONTRIBUTING.md
- License: LICENSE
- Security: SECURITY.md
- Agents: AGENTS.md
Awesome Lists containing this project
- awesome-openclaw-money-maker - **clawmetry** - Real-time observability dashboard for OpenClaw agents. See your agent think. (AI Agent Frameworks / OpenClaw Infrastructure)
- awesome-openclaw - vivekchand/clawmetry - Open source observability for OpenClaw: token costs, session drift, memory alerts. `pip install clawmetry`. Nothing leaves your machine. (🎛️ Dashboards & Control Centers)
- awesome-openclaw-dashboards - vivekchand/clawmetry - Telemetry and monitoring project for OpenClaw. (Observability & Monitoring)
- awesome-openclaw-resources - ClawMetry - Real-time observability dashboard with token and cost tracking with daily, weekly, and monthly breakdowns. (Open Source Projects / Observability)
README
# 🦞 ClawMetry
[](https://clickpy.clickhouse.com/dashboard/clawmetry)
[](https://clickpy.clickhouse.com/dashboard/clawmetry)
[](https://pypi.org/project/clawmetry/)
[](https://github.com/vivekchand/clawmetry/stargazers)
[](https://opensource.org/licenses/MIT)

**See your agent think.** Real-time observability for **12 AI agent runtimes**: [OpenClaw](https://github.com/openclaw/openclaw), [NVIDIA NemoClaw](https://github.com/NVIDIA/NemoClaw), Claude Code, OpenAI Codex & 8 more. One dashboard for your whole agent fleet.
> 🌐 **Read this in:** [English](README.md) · [简体中文](docs/i18n/zh-CN/README.md) · [日本語](docs/i18n/ja/README.md) · [한국어](docs/i18n/ko/README.md) · [Español](docs/i18n/es/README.md) · [Português (BR)](docs/i18n/pt-BR/README.md) · [Français](docs/i18n/fr/README.md) · [Deutsch](docs/i18n/de/README.md) · [हिन्दी](docs/i18n/hi/README.md) · [العربية](docs/i18n/ar/README.md) · [Русский](docs/i18n/ru/README.md) · [more →](docs/i18n/)
One command. Zero config. Auto-detects everything.
```bash
pip install clawmetry && clawmetry
```
Opens at **http://localhost:8900** and you're done.
## Works with 12 agent runtimes
ClawMetry started as observability for OpenClaw, and now meters your **whole agent fleet** in one dashboard, auto-detecting each runtime on your machine:
🦞 **OpenClaw** · 🟩 **NVIDIA NemoClaw** · ◆ **Claude Code** · ⬡ **OpenAI Codex** · **Cursor** · 🪿 **Goose** · ⚡ **Hermes** · **opencode** · ◈ **Qwen Code** · **Aider** · **NanoClaw** · **PicoClaw**
OpenClaw and NemoClaw are free in the open-source app; the other runtimes light up with ClawMetry Cloud or a self-hosted Pro license. Switch runtimes from the header and every tab — cost, tokens, tools, traces — re-scopes to that runtime.
## What You Get
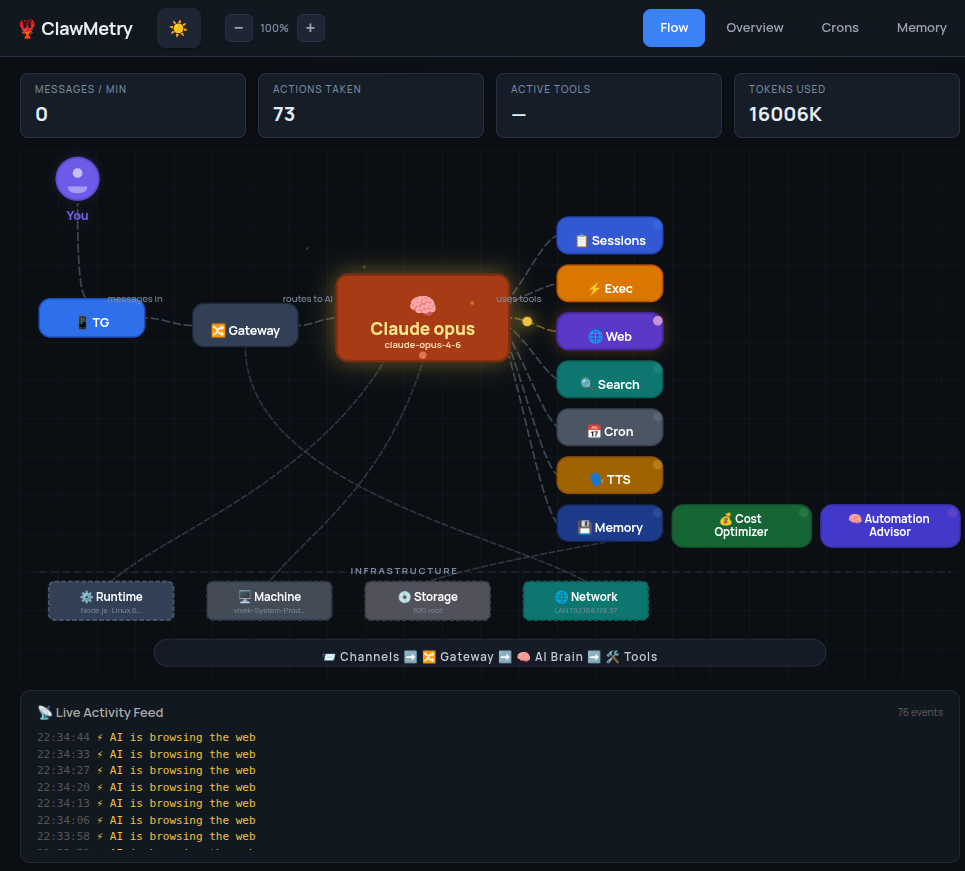
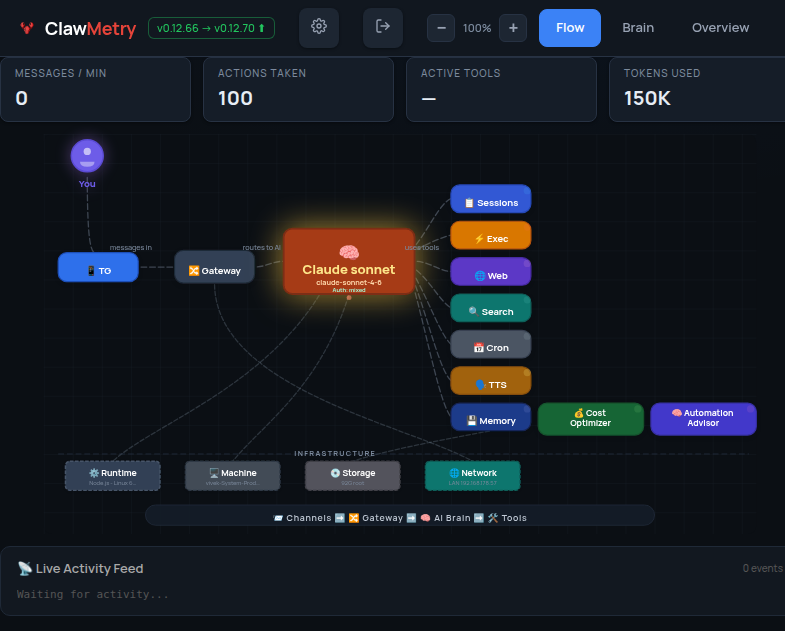
- **Flow** — Live animated diagram showing messages flowing through channels, brain, tools, and back
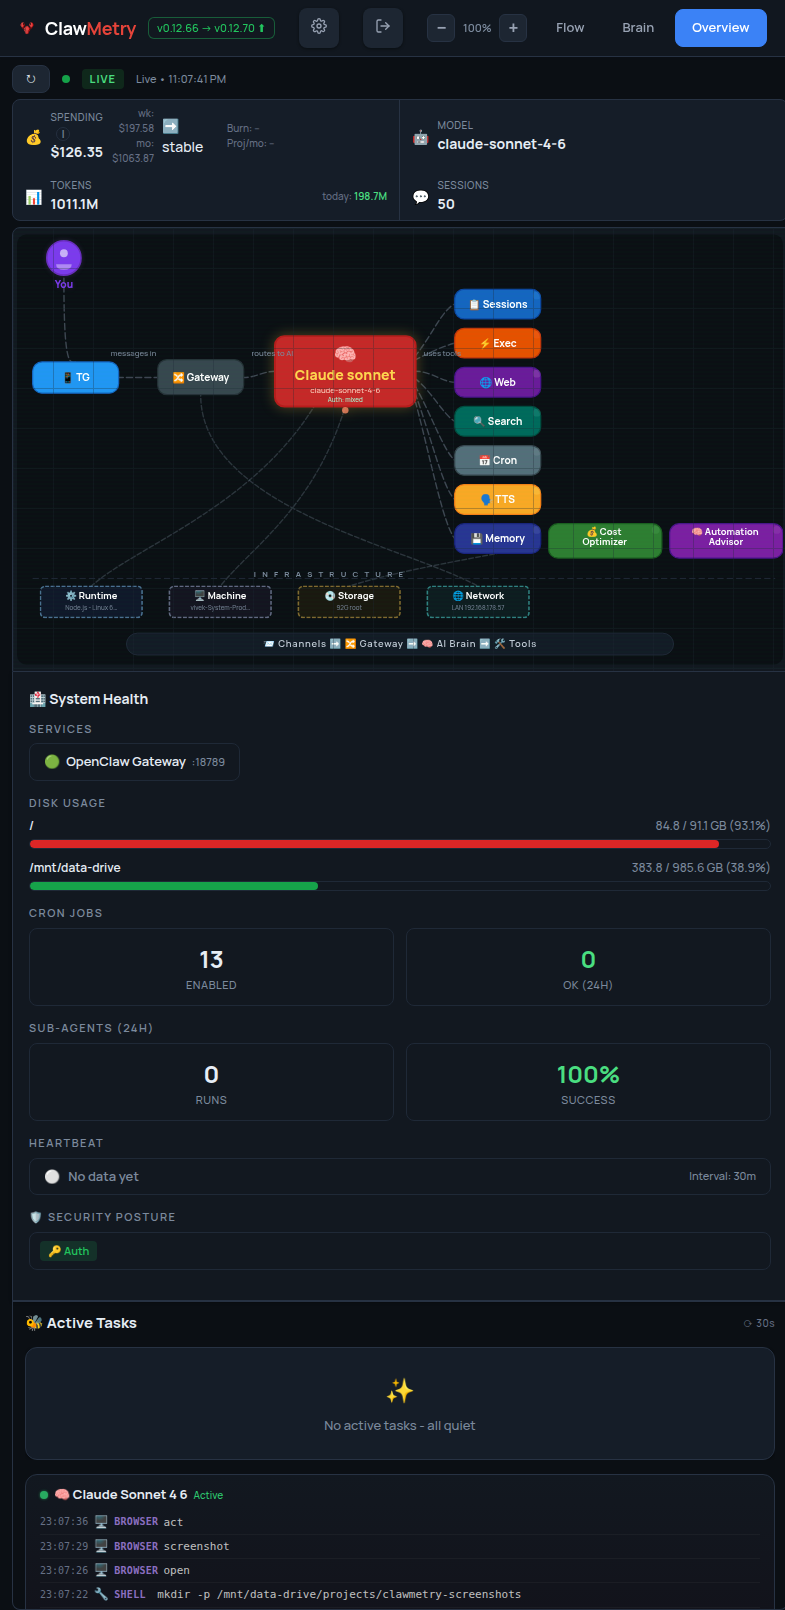
- **Overview** — Health checks, activity heatmap, session counts, model info
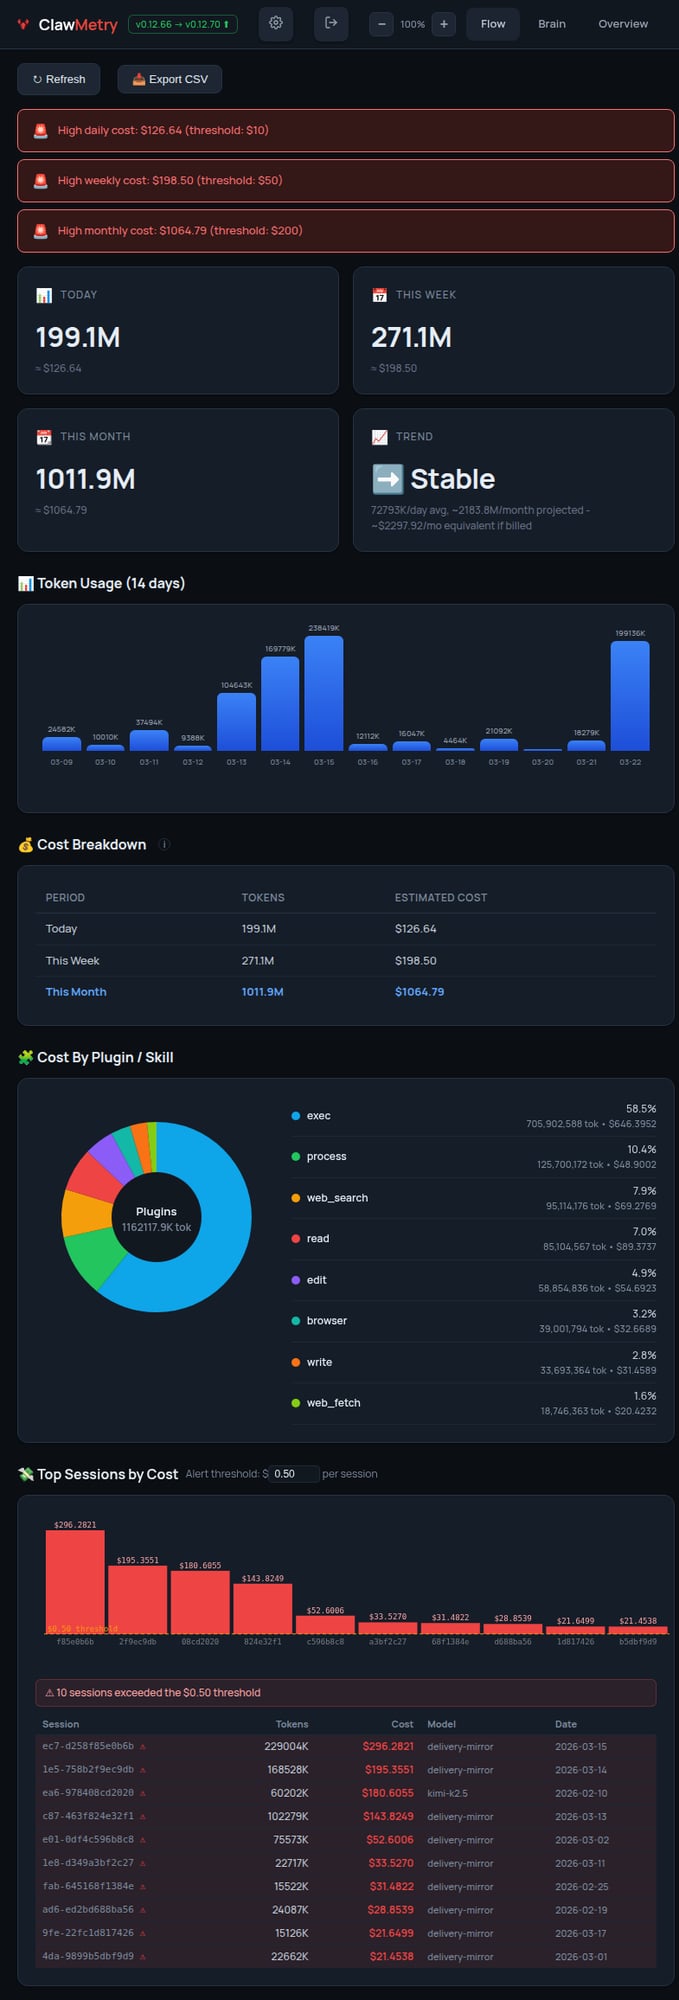
- **Usage** — Token and cost tracking with daily/weekly/monthly breakdowns
- **Sessions** — Active agent sessions with model, tokens, last activity
- **Crons** — Scheduled jobs with status, next run, duration
- **Logs** — Color-coded real-time log streaming
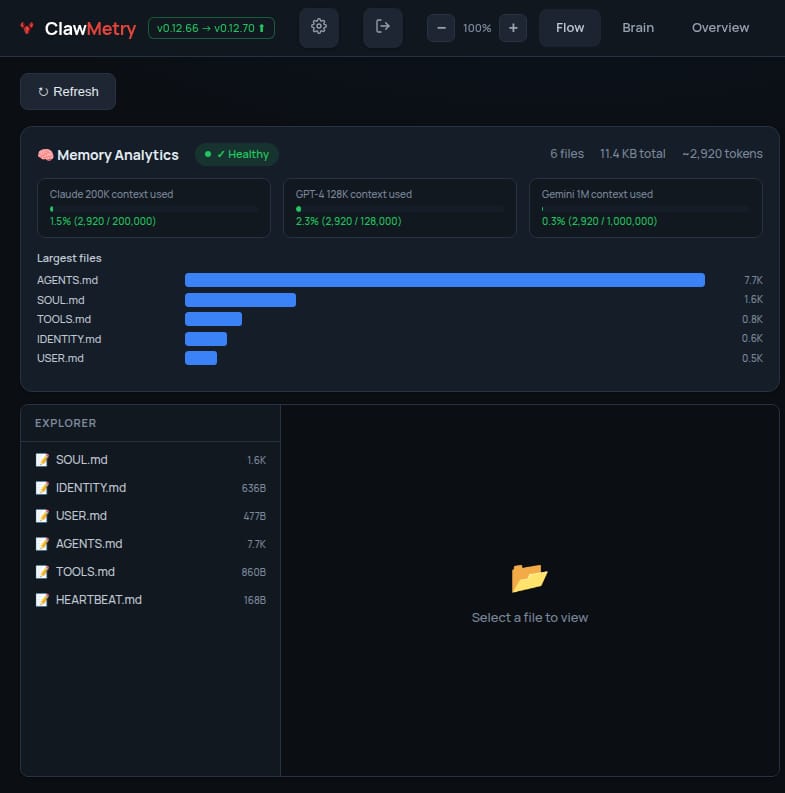
- **Memory** — Browse SOUL.md, MEMORY.md, AGENTS.md, daily notes
- **Transcripts** — Chat-bubble UI for reading session histories
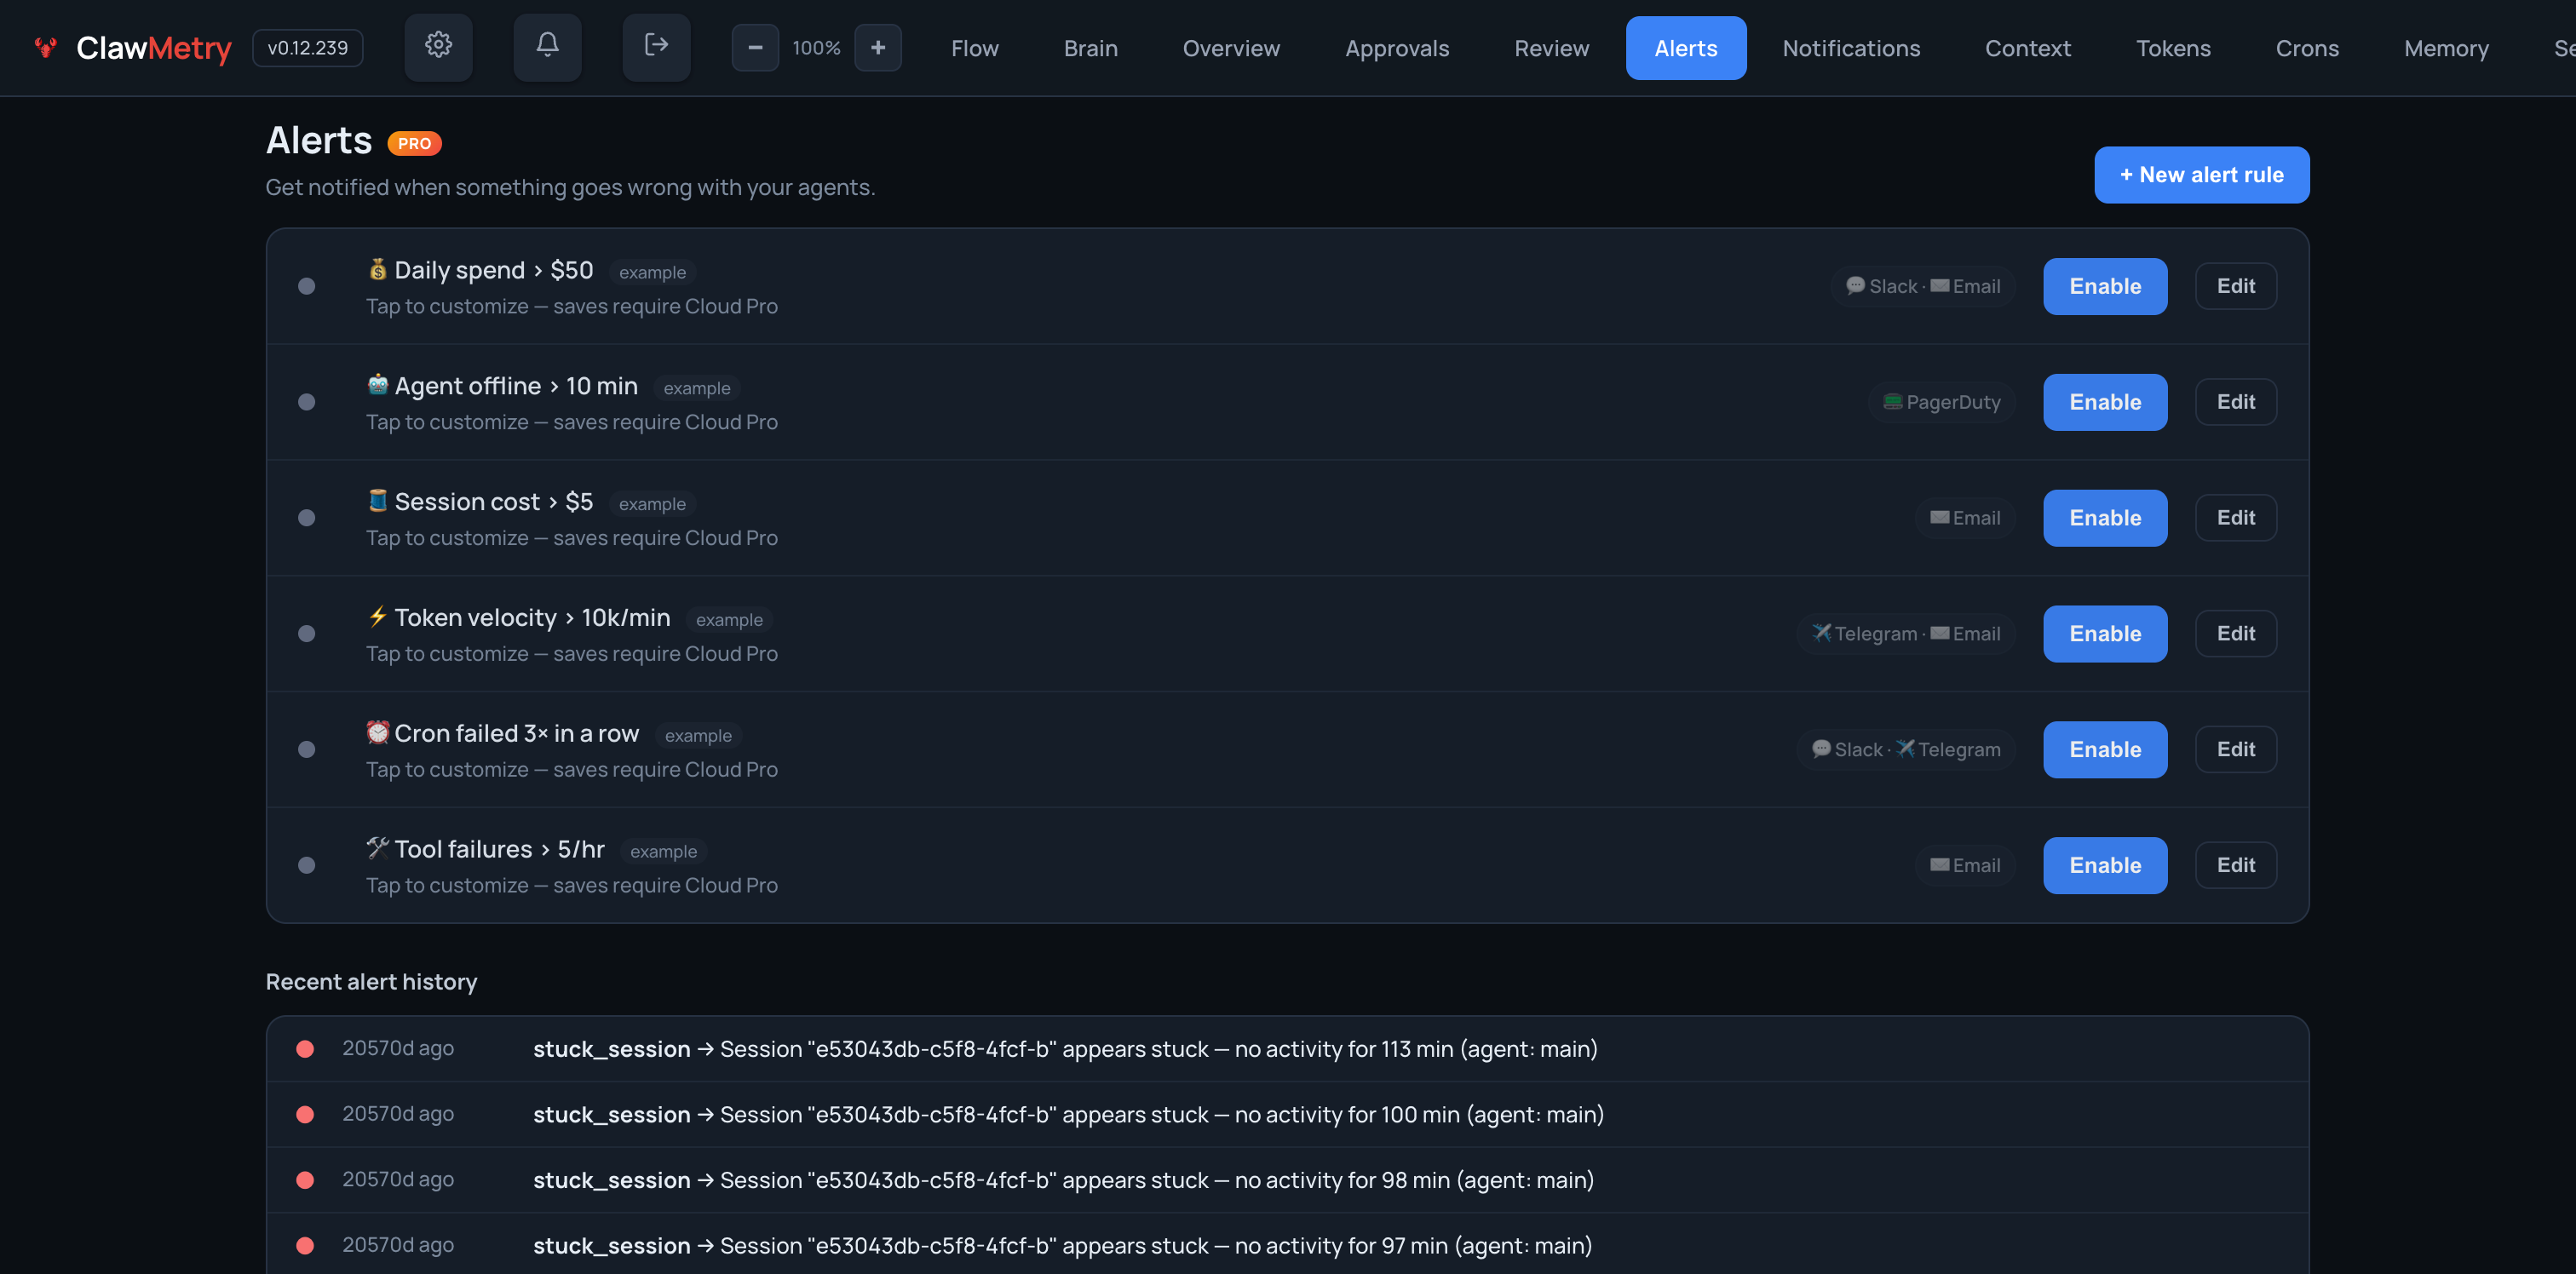
- **Alerts** — Budget caps, error-rate triggers, agent-offline detection; routes to Slack, Discord, PagerDuty, Telegram, Email
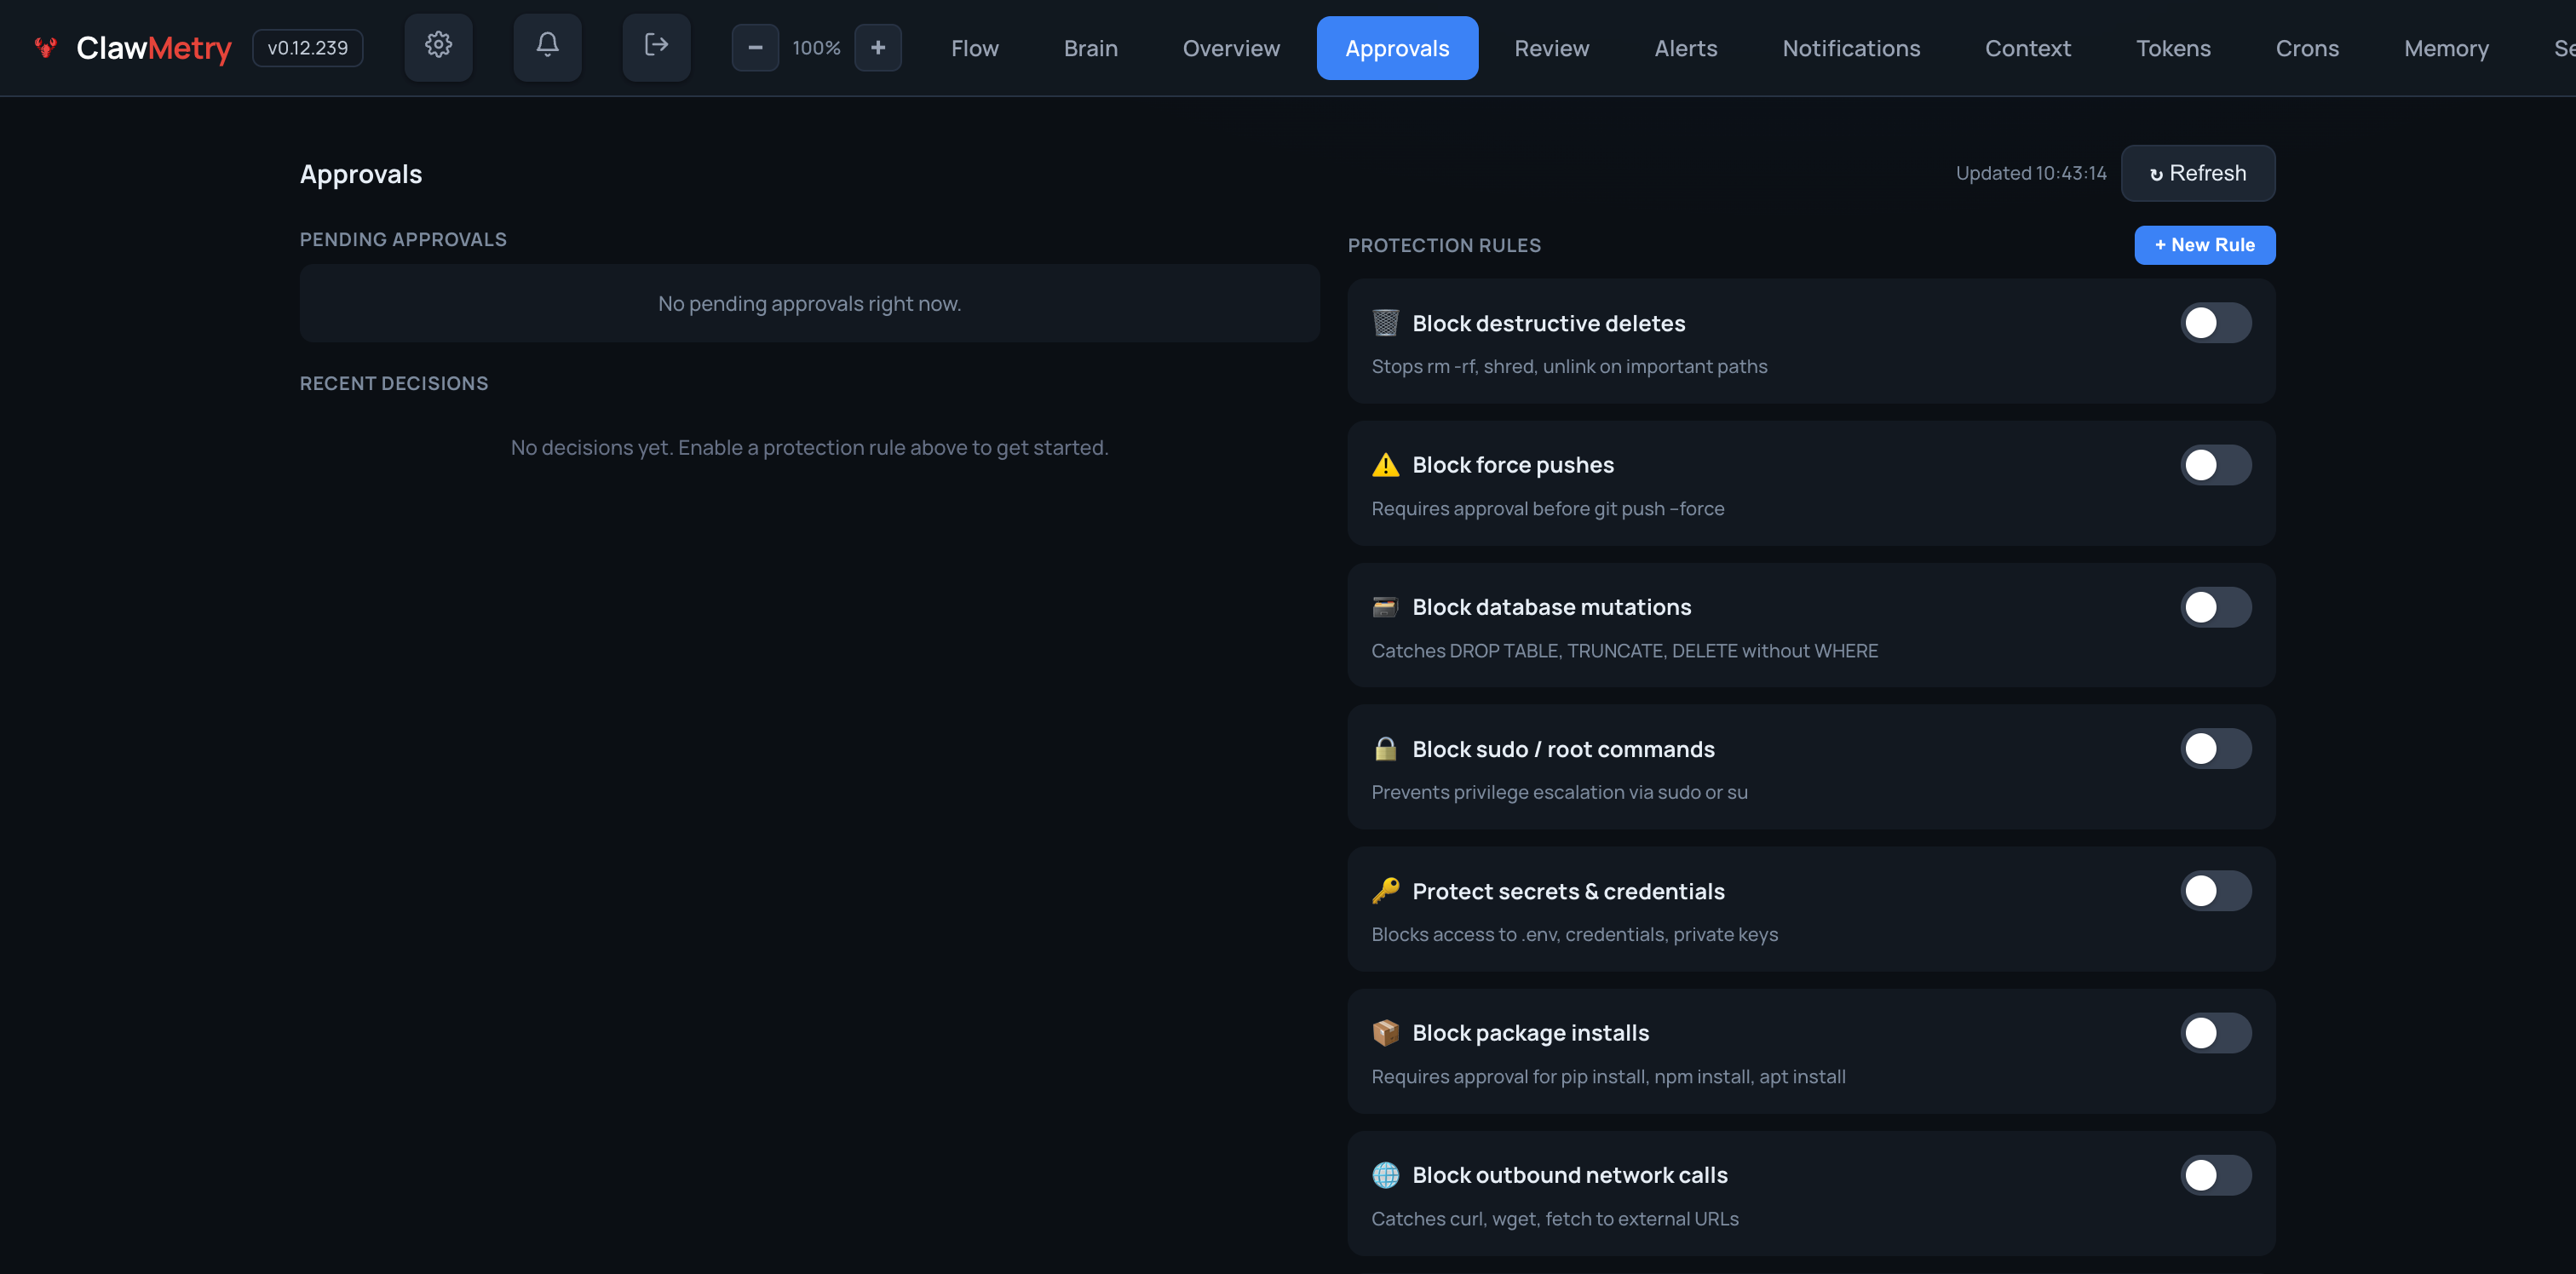
- **Approvals** — Gate destructive deletes, force pushes, DB mutations, sudo, package installs, network calls behind one-click sign-off
## Screenshots
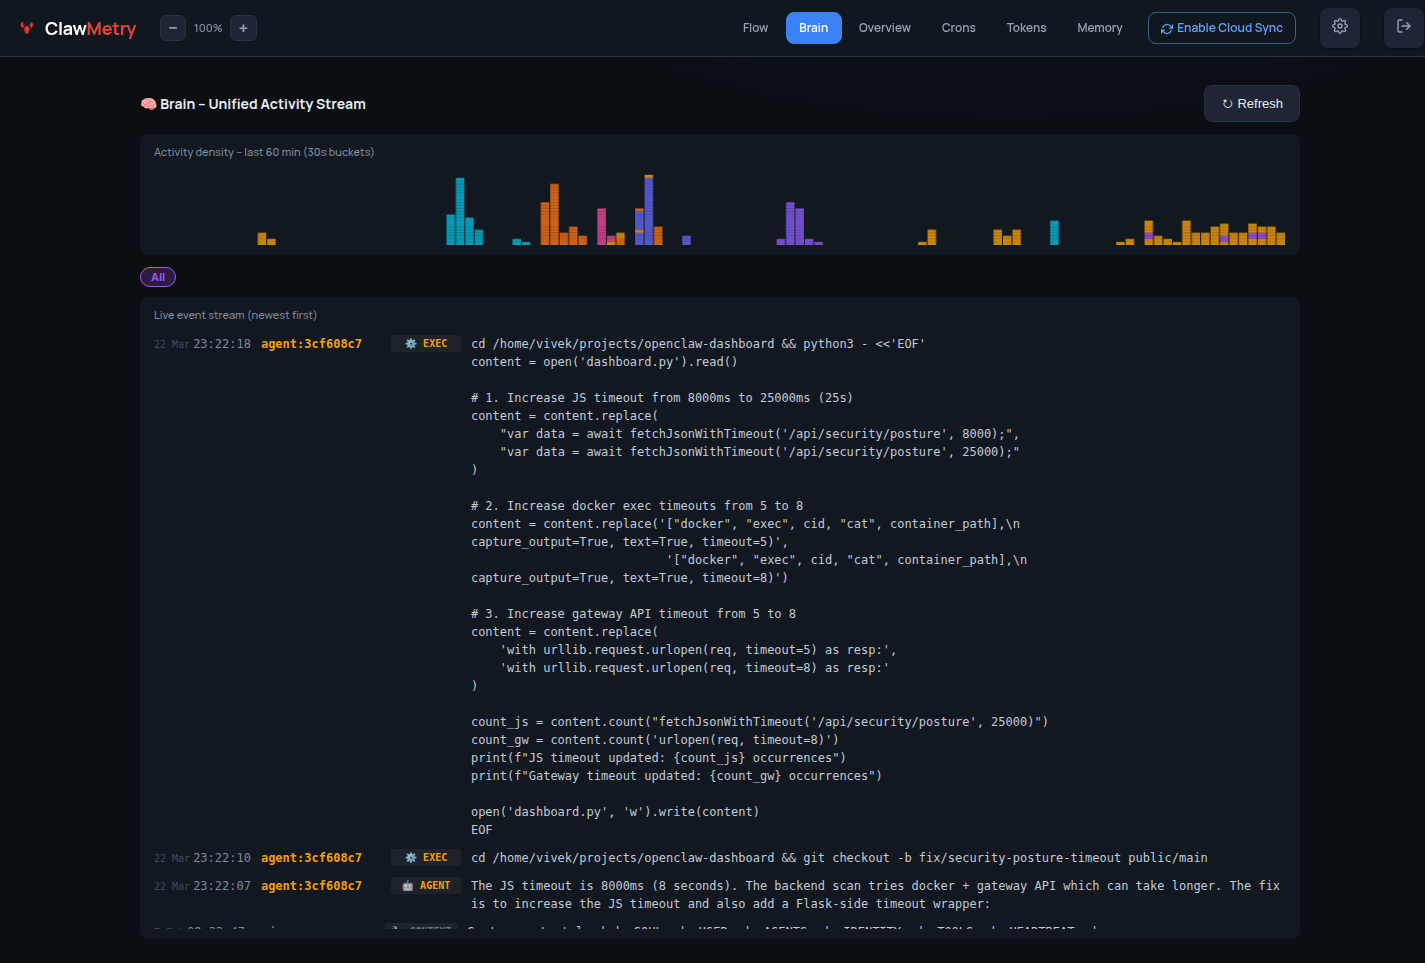
### 🧠 Brain — Live agent event stream
### 📊 Overview — Token usage & session summary
### ⚡ Flow — Real-time tool call feed
### 💰 Tokens — Cost breakdown by model & session
### 🧬 Memory — Workspace file browser
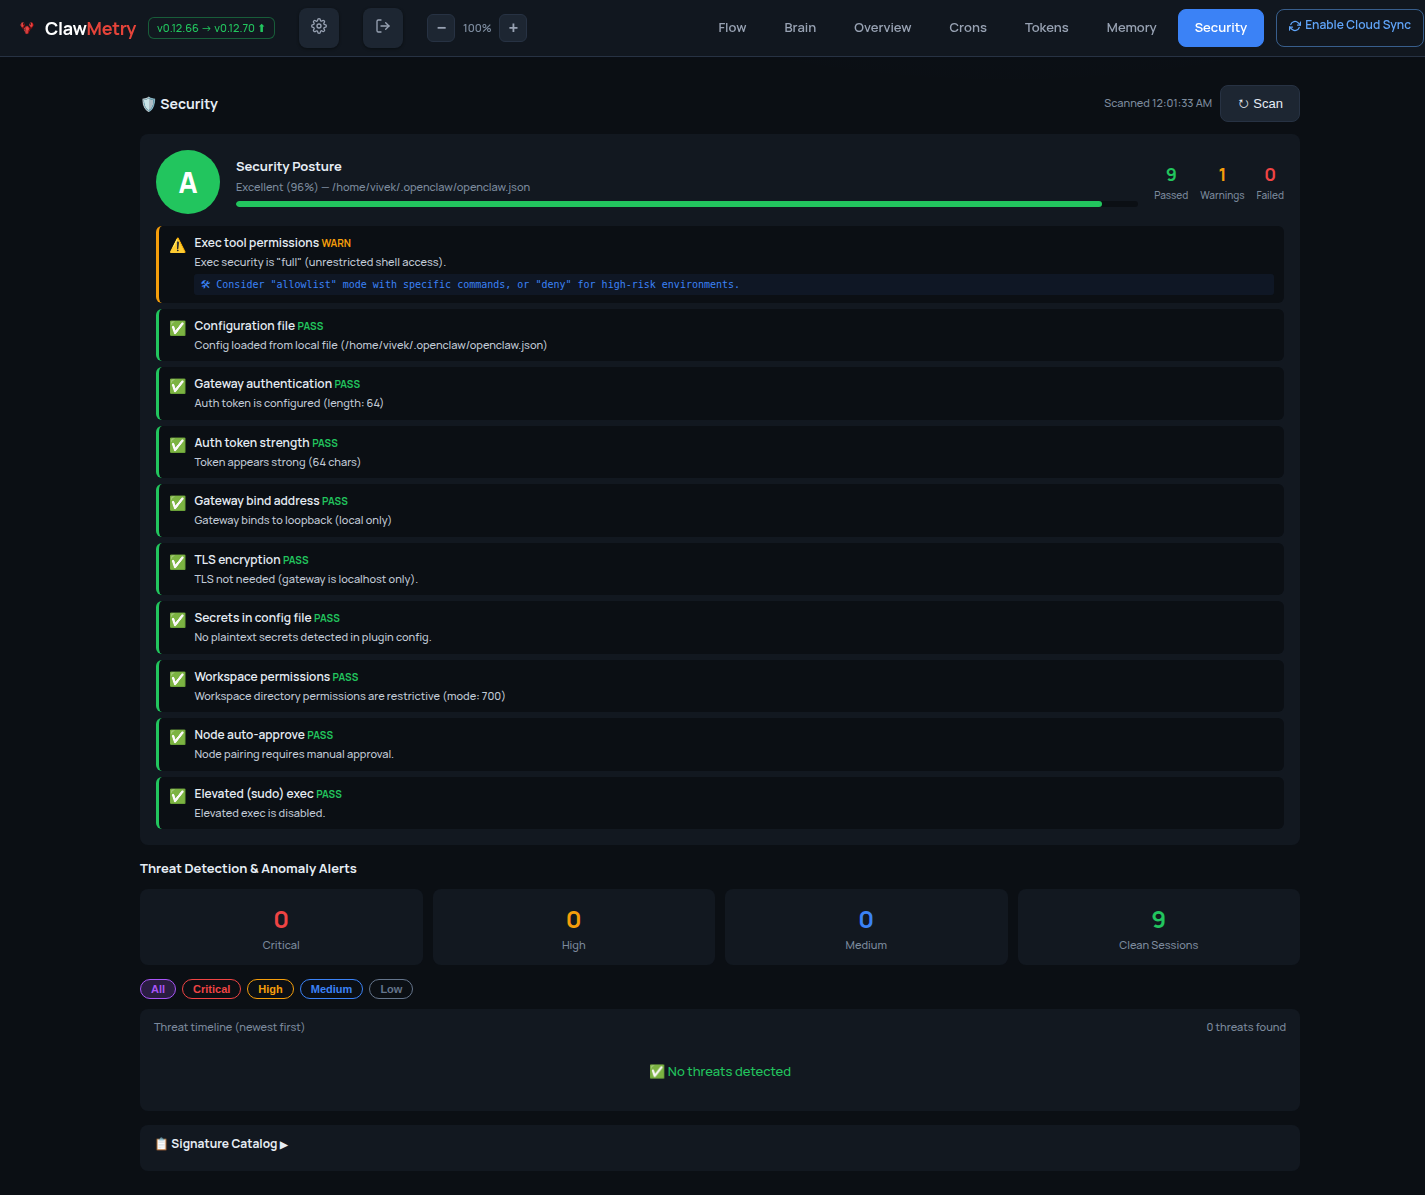
### 🔐 Security — Posture & audit log
### 🚨 Alerts — Budget caps, error-rate triggers, webhooks to Slack / Discord / PagerDuty / Email
### ✋ Approvals — Gate risky tool calls behind manual sign-off; policy-backed protection rules
## Install
**One-liner (recommended):**
```bash
curl -sSL https://raw.githubusercontent.com/vivekchand/clawmetry/main/install.sh | bash
```
**pip:**
```bash
pip install clawmetry
clawmetry
```
**From source:**
```bash
git clone https://github.com/vivekchand/clawmetry.git
cd clawmetry && pip install flask && python3 dashboard.py
```
## v2 Frontend Development
The v2 React app lives in `frontend/` and is served at `/v2` when the Flask
server is started with v2 enabled.
Use two terminals while developing:
```bash
# Terminal 1: Flask API/server on :8900
CLAWMETRY_V2=1 python3 dashboard.py
```
```bash
# Terminal 2: Vite dev server on :5173
cd frontend
nvm use
npm ci
npm run dev
```
Open `http://localhost:5173/v2/`. Vite proxies `/api` requests to
`http://localhost:8900`, so the React app can talk to the local Flask server
without extra CORS setup.
To build the bundle that ships with the Python package:
```bash
cd frontend
npm run build
```
The production bundle is written to `clawmetry/static/v2/dist/`.
## Runtime / Agent Compatibility
ClawMetry observes many AI-agent runtimes, not just OpenClaw. Each non-OpenClaw runtime ships a dedicated reader adapter that translates its native session format into ClawMetry's unified shapes; the daemon ingests them into the same DuckDB store + cloud snapshot, tagged with the runtime, and the Session replay tab shows a **runtime switcher** when more than one is present. See [`docs/compatibility.md`](docs/compatibility.md) for the full matrix + a guide to adding runtimes, and [`docs/RUNTIME_FAMILY.md`](docs/RUNTIME_FAMILY.md) for the OpenClaw-family primer.
| Runtime / Agent | Status | Notes |
|---|---|---|
| **OpenClaw** | Native | Reference runtime, auto-detected |
| **PicoClaw** | Beta adapter | Flat `providers.Message` JSONL (`~/.picoclaw/workspace/sessions`). Transcripts, model, tool calls. |
| **NanoClaw** | Beta adapter | Per-session SQLite (`data/v2-sessions`). Transcripts + message counts. |
| **Hermes** | Beta adapter | SQLite `~/.hermes/state.db`. Transcripts, model, tokens/cost. |
| **Claude Code** | Beta adapter | JSONL `~/.claude/projects/.../.jsonl`. Transcripts, model, tool calls + thinking, token usage. |
| **Codex** | Beta adapter | Rollout JSONL `~/.codex/sessions/...`. Transcripts, model, tool calls, token usage. |
| **Cursor** | Beta adapter | SQLite `state.vscdb`. Chat/composer transcripts, model. |
| **Aider** | Beta adapter | `.aider.chat.history.md` per project. Transcripts, model, token counts. |
| **Goose** | Beta adapter | SQLite `~/.local/share/goose`. Transcripts, model, tool calls, token totals. |
| **opencode** | Beta adapter | SQLite `~/.local/share/opencode`. Transcripts, model, tool calls, tokens + cost. |
| **Qwen Code** | Beta adapter | JSONL `~/.qwen/projects/.../chats`. Transcripts, model, tool calls, token usage. |
"Beta adapter" means ClawMetry ships a reader for that runtime's real on-disk format, each built + verified against a real install on a real machine (see `tests/fixtures/runtimes//`). Adapters are read-only; each is honest about what its runtime actually stores (e.g. PicoClaw/NanoClaw/Cursor don't write token cost to disk). When several runtimes run on one node, the runtime switcher scopes the sessions view to one for a clean deep-dive.
## Track any SDK agent — out-loop cost attribution
The runtimes above all write sessions to disk. Your own **production agent** — the one you built on the OpenAI Agents SDK, LangChain, the Vercel AI SDK, LlamaIndex, E2B, or a plain `httpx` loop — doesn't. ClawMetry's zero-config interceptor still captures its LLM calls (cost, tokens, latency, errors) by monkey-patching `httpx`/`requests`:
```python
import clawmetry.track # activate the interceptor
clawmetry.track.set_source("support-agent") # name this product
# ...your agent runs as normal; every LLM call is now tracked + attributed.
```
`set_source()` (or the `CLAWMETRY_SOURCE=support-agent` env var) tags each call with a **named source**, so every product you run shows up as its own first-class, cost-attributable line in the dashboard's **🔌 Out-loop sources** card on Overview — calls, providers, latency, error rate per agent. No source set? The calls are still tracked; the card just stays hidden.
```bash
CLAWMETRY_SOURCE=billing-agent python my_agent.py
```
This is the same data layer the runtime adapters feed (DuckDB → cloud snapshot), so out-loop sources sync to the cloud dashboard the same as everything else, E2E-encrypted.
## OpenTelemetry — vendor-neutral, send your traces anywhere
ClawMetry speaks **OpenTelemetry** in both directions, using the **GenAI semantic conventions**, so your agent traces are never locked into one tool.
**Export** every session — LLM calls, tools, sub-agents, tokens, cost — as OTLP/HTTP GenAI spans to any collector (Datadog, Grafana, Honeycomb, or your own OTel Collector):
```bash
clawmetry --otel-export http://localhost:4318/v1/traces
# equivalently:
CLAWMETRY_OTEL_EXPORT_ENDPOINT=http://localhost:4318/v1/traces clawmetry
```
Auth headers and poll interval are optional env vars:
```bash
CLAWMETRY_OTEL_EXPORT_HEADERS='{"X-API-Key":"…"}' # extra HTTP headers
CLAWMETRY_OTEL_EXPORT_INTERVAL=60 # seconds (default 60)
```
**Ingest** — the built-in OTLP receiver accepts traces and metrics from anything else at `/v1/traces` and `/v1/metrics` (`pip install clawmetry[otel]` for protobuf ingest).
You get the zero-config, local-first ClawMetry dashboard **and** your data in whatever backend your team already runs — no lock-in, no second agent to install.
## Configuration
Most people don't need any config. ClawMetry auto-detects your workspace, logs, sessions, and crons.
If you do need to customize:
```bash
clawmetry --port 9000 # Custom port (default: 8900)
clawmetry --host 127.0.0.1 # Bind to localhost only
clawmetry --workspace ~/mybot # Custom workspace path
clawmetry --name "Alice" # Your name in Flow visualization
```
All options: `clawmetry --help`
## Supported Channels
ClawMetry shows live activity for every OpenClaw channel you have configured. Only channels that are actually set up in your `openclaw.json` appear in the Flow diagram — unconfigured ones are automatically hidden.
Click any channel node in the Flow to see a live chat bubble view with incoming/outgoing message counts.
| Channel | Status | Live Popup | Notes |
|---------|--------|------------|-------|
| 📱 **Telegram** | ✅ Full | ✅ | Messages, stats, 10s refresh |
| 💬 **iMessage** | ✅ Full | ✅ | Reads `~/Library/Messages/chat.db` directly |
| 💚 **WhatsApp** | ✅ Full | ✅ | Via WhatsApp Web (Baileys) |
| 🔵 **Signal** | ✅ Full | ✅ | Via signal-cli |
| 🟣 **Discord** | ✅ Full | ✅ | Guild + channel detection |
| 🟪 **Slack** | ✅ Full | ✅ | Workspace + channel detection |
| 🌐 **Webchat** | ✅ Full | ✅ | Built-in web UI sessions |
| 📡 **IRC** | ✅ Full | ✅ | Terminal-style bubble UI |
| 🍏 **BlueBubbles** | ✅ Full | ✅ | iMessage via BlueBubbles REST API |
| 🔵 **Google Chat** | ✅ Full | ✅ | Via Chat API webhooks |
| 🟣 **MS Teams** | ✅ Full | ✅ | Via Teams bot plugin |
| 🔷 **Mattermost** | ✅ Full | ✅ | Self-hosted team chat |
| 🟩 **Matrix** | ✅ Full | ✅ | Decentralized, E2EE support |
| 🟢 **LINE** | ✅ Full | ✅ | LINE Messaging API |
| ⚡ **Nostr** | ✅ Full | ✅ | Decentralized NIP-04 DMs |
| 🟣 **Twitch** | ✅ Full | ✅ | Chat via IRC connection |
| 🔷 **Feishu/Lark** | ✅ Full | ✅ | WebSocket event subscription |
| 🔵 **Zalo** | ✅ Full | ✅ | Zalo Bot API |
> **Auto-detection:** ClawMetry reads your `~/.openclaw/openclaw.json` and only renders the channels you've actually configured. No manual setup required.
## Docker Deployment
Want to run ClawMetry in a container? No problem! 🐳
**Quick start with Docker:**
```bash
# Build the image
docker build -t clawmetry .
# Run with default settings
docker run -p 8900:8900 clawmetry
# Or mount your agent's data dir (shown: OpenClaw's ~/.openclaw)
docker run -p 8900:8900 \
-v ~/.openclaw:/root/.openclaw \
-v /tmp/moltbot:/tmp/moltbot \
clawmetry
```
**Docker Compose example:**
```yaml
version: '3.8'
services:
clawmetry:
build: .
ports:
- "8900:8900"
volumes:
- ~/.openclaw:/root/.openclaw:ro
- /tmp/moltbot:/tmp/moltbot:ro
restart: unless-stopped
```
> **Note:** When running in Docker, mount your agent's data + log directories (e.g. `~/.openclaw`, `~/.claude`, `~/.codex`) so ClawMetry can auto-detect your setup.
## Requirements
- Python 3.8+
- Flask (installed automatically via pip)
- An AI agent runtime on the same machine: OpenClaw, NVIDIA NemoClaw, Claude Code, Codex, Cursor, Goose, Hermes, opencode, Qwen Code, Aider, NanoClaw, or PicoClaw (or mounted volumes for Docker)
- Linux or macOS
## NemoClaw / OpenShell Support
ClawMetry automatically detects [NemoClaw](https://github.com/NVIDIA/NemoClaw) — NVIDIA's enterprise security wrapper for OpenClaw that runs agents inside sandboxed OpenShell containers.
No extra configuration is needed in most cases. The sync daemon auto-discovers session files whether they live in `~/.openclaw/` on the host or inside an OpenShell container.
### How it works
ClawMetry detects NemoClaw in two ways:
1. **Binary detection** — checks for the `nemoclaw` CLI and runs `nemoclaw status` to get sandbox info
2. **Container detection** — scans running Docker containers for `openshell`, `nemoclaw`, or `ghcr.io/nvidia/` images, then reads sessions via volume mounts or `docker cp`
Session files synced from NemoClaw containers are tagged with `runtime=nemoclaw` and `container_id` metadata in the cloud dashboard, so you can tell them apart from standard OpenClaw sessions at a glance.
### Recommended setup: sync daemon on the HOST
For the best experience, run ClawMetry's sync daemon on the **host machine** (not inside the sandbox). This avoids NemoClaw network policy restrictions.
```bash
# On the host (outside the sandbox)
pip install clawmetry
clawmetry connect
clawmetry sync
```
The sync daemon will automatically find sessions inside any running OpenShell containers.
### Optional: explicit sandbox name
If auto-detection doesn't work, point ClawMetry at the right sandbox:
```bash
export NEMOCLAW_SANDBOX=my-sandbox-name
clawmetry sync
```
### Running inside the sandbox (advanced)
If you must run the sync daemon **inside** the OpenShell sandbox, add this egress rule to your NemoClaw network policy so it can reach the ClawMetry ingest API:
```yaml
# nemoclaw-policy.yaml
network:
egress:
- host: ingest.clawmetry.com
port: 443
protocol: https
```
Apply with:
```bash
nemoclaw policy apply --file nemoclaw-policy.yaml
```
### Ports and endpoints
| Endpoint | Port | Protocol | Required |
|---|---|---|---|
| `ingest.clawmetry.com` | 443 | HTTPS | Yes (sync daemon → cloud) |
| `localhost:8900` | 8900 | HTTP | Yes (local dashboard UI) |
| Docker socket (`/var/run/docker.sock`) | — | Unix socket | For container session discovery |
The sync daemon only makes outbound HTTPS calls to `ingest.clawmetry.com`. No inbound ports are required.
---
## Cloud Deployment
See the **[Cloud Testing Guide](https://github.com/vivekchand/clawmetry/blob/main/docs/CLOUD_TESTING.md)** for SSH tunnels, reverse proxy, and Docker.
## Testing
This project is tested with BrowserStack.
[](https://browserstack.com)
## Telemetry
ClawMetry sends a single anonymous "first run" ping to
`https://app.clawmetry.com/api/install` the first time you run the
`clawmetry` CLI on a new machine. We use this to count installs (the
only marketing metric we have for an OSS project) and to learn which
agent frameworks our users have installed.
**Exactly one POST per install**, containing:
| Field | Example | Why |
|---|---|---|
| `install_id` | random UUID stored at `~/.clawmetry/install_id` | dedup; not linked to your email or api_key |
| `version` | `0.12.167` | what versions are in the wild |
| `os` / `os_version` | `Darwin` / `25.3.0` | platform support priorities |
| `python` | `3.11.15` | Python version support matrix |
| `agent` | `openclaw` / `nemoclaw` / `hermes` / `none` | which agents we should integrate with next |
| `is_ci` / `ci_provider` | `true` / `github_actions` | separate human installs from CI noise |
**What we do NOT send**: IP (cloud derives the country code server-side
from the request, then discards the IP), hostname, username, workspace
path, file contents, your api_key, your email, anything PII or
workspace-specific. The wire payload is auditable in
[`clawmetry/telemetry.py`](clawmetry/telemetry.py).
**Opt out** (any one of these disables it permanently):
```bash
export CLAWMETRY_NO_TELEMETRY=1 # per-shell
export DO_NOT_TRACK=1 # W3C cross-tool standard
touch ~/.clawmetry/notelemetry # persistent file marker
```
A network failure here never blocks `clawmetry` from running — the
ping is fire-and-forget on a daemon thread with a 3 s timeout.
## Star History

## License
MIT
---
🦞 See your agent think
Built by @vivekchand · clawmetry.com · Part of the OpenClaw ecosystem