https://github.com/vsergeyev/loudml-grafana-app
Visualization panel and datasource for Grafana to connect with Loud ML AI solution for ICT and IoT automation
https://github.com/vsergeyev/loudml-grafana-app
ai anomaly-detection baseline datasource docker donut grafana graph loudml machine-learning ml model monitoring panel plugin prediction
Last synced: 6 months ago
JSON representation
Visualization panel and datasource for Grafana to connect with Loud ML AI solution for ICT and IoT automation
- Host: GitHub
- URL: https://github.com/vsergeyev/loudml-grafana-app
- Owner: vsergeyev
- License: mit
- Created: 2020-02-28T12:15:15.000Z (over 6 years ago)
- Default Branch: master
- Last Pushed: 2023-01-26T17:56:21.000Z (over 3 years ago)
- Last Synced: 2024-05-28T23:03:41.832Z (about 2 years ago)
- Topics: ai, anomaly-detection, baseline, datasource, docker, donut, grafana, graph, loudml, machine-learning, ml, model, monitoring, panel, plugin, prediction
- Language: TypeScript
- Homepage: https://vsergeyev.github.io/loudml-grafana-app/
- Size: 10.1 MB
- Stars: 48
- Watchers: 10
- Forks: 20
- Open Issues: 34
-
Metadata Files:
- Readme: README.md
- License: LICENSE
Awesome Lists containing this project
README
# LoudML Grafana Application
Visualization panel and datasource for Grafana 6.7.x - 7.x to connect with Loud ML AI solution for ICT and IoT
automation. https://loudml.io
Loud ML is an open source inference engine for metrics and events, and the fastest way to embed machine learning in your time series application. This includes APIs for storing and querying data, processing it in the background for ML or detecting outliers for alerting purposes, and more.
https://github.com/regel/loudml
# Installation
Repository conventions:
* `master` branch is for Grafana 7
* `grafana/6.x` branch is for Grafana 6
ZIP files has packaged plugin for each of Grafana version supported.
A) Give it a try with Docker
docker run -d \
-p 3000:3000 \
--name=grafana \
-e "GF_INSTALL_PLUGINS=https://github.com/vsergeyev/loudml-grafana-app/raw/master/loudml-grafana-app-latest.zip;loudml-grafana-app" \
grafana/grafana
Setup LoudML if needed (please refer to https://hub.docker.com/r/loudml/loudml for config.yml setup)
docker run -p 8077:8077 \
-v $PWD/lib/loudml:/var/lib/loudml:rw \
-v $PWD/config.yml:/etc/loudml/config.yml:ro \
-ti \
loudml/loudml
B) In existing Grafana container
* Connect to your Grafana server if necessary (e.g. via SSH).
* Go to plugins directory (usually data/plugins under Grafana installation or /var/lib/grafana/plugins)
cd /var/lib/grafana/plugins
* Download loudml-grafana-app-latest.zip zip file:
wget https://github.com/vsergeyev/loudml-grafana-app/raw/master/loudml-grafana-app-latest.zip
* Unpack it there
unzip loudml-grafana-app-latest.zip
* You may remove the downloaded archive
* Restart Grafana
C) From sources (note - default `master` branch is for Grafana 7.x)
* Plugin should be placed in `.../grafana/data/plugins`
* git clone https://github.com/vsergeyev/loudml-grafana-app.git
* cd loudml-grafana-app
* yarn
* yarn dev --watch
* restart Grafana
* LoudML app should be in plugins list, you may need to activate it
* enjoy :)
# Whats inside
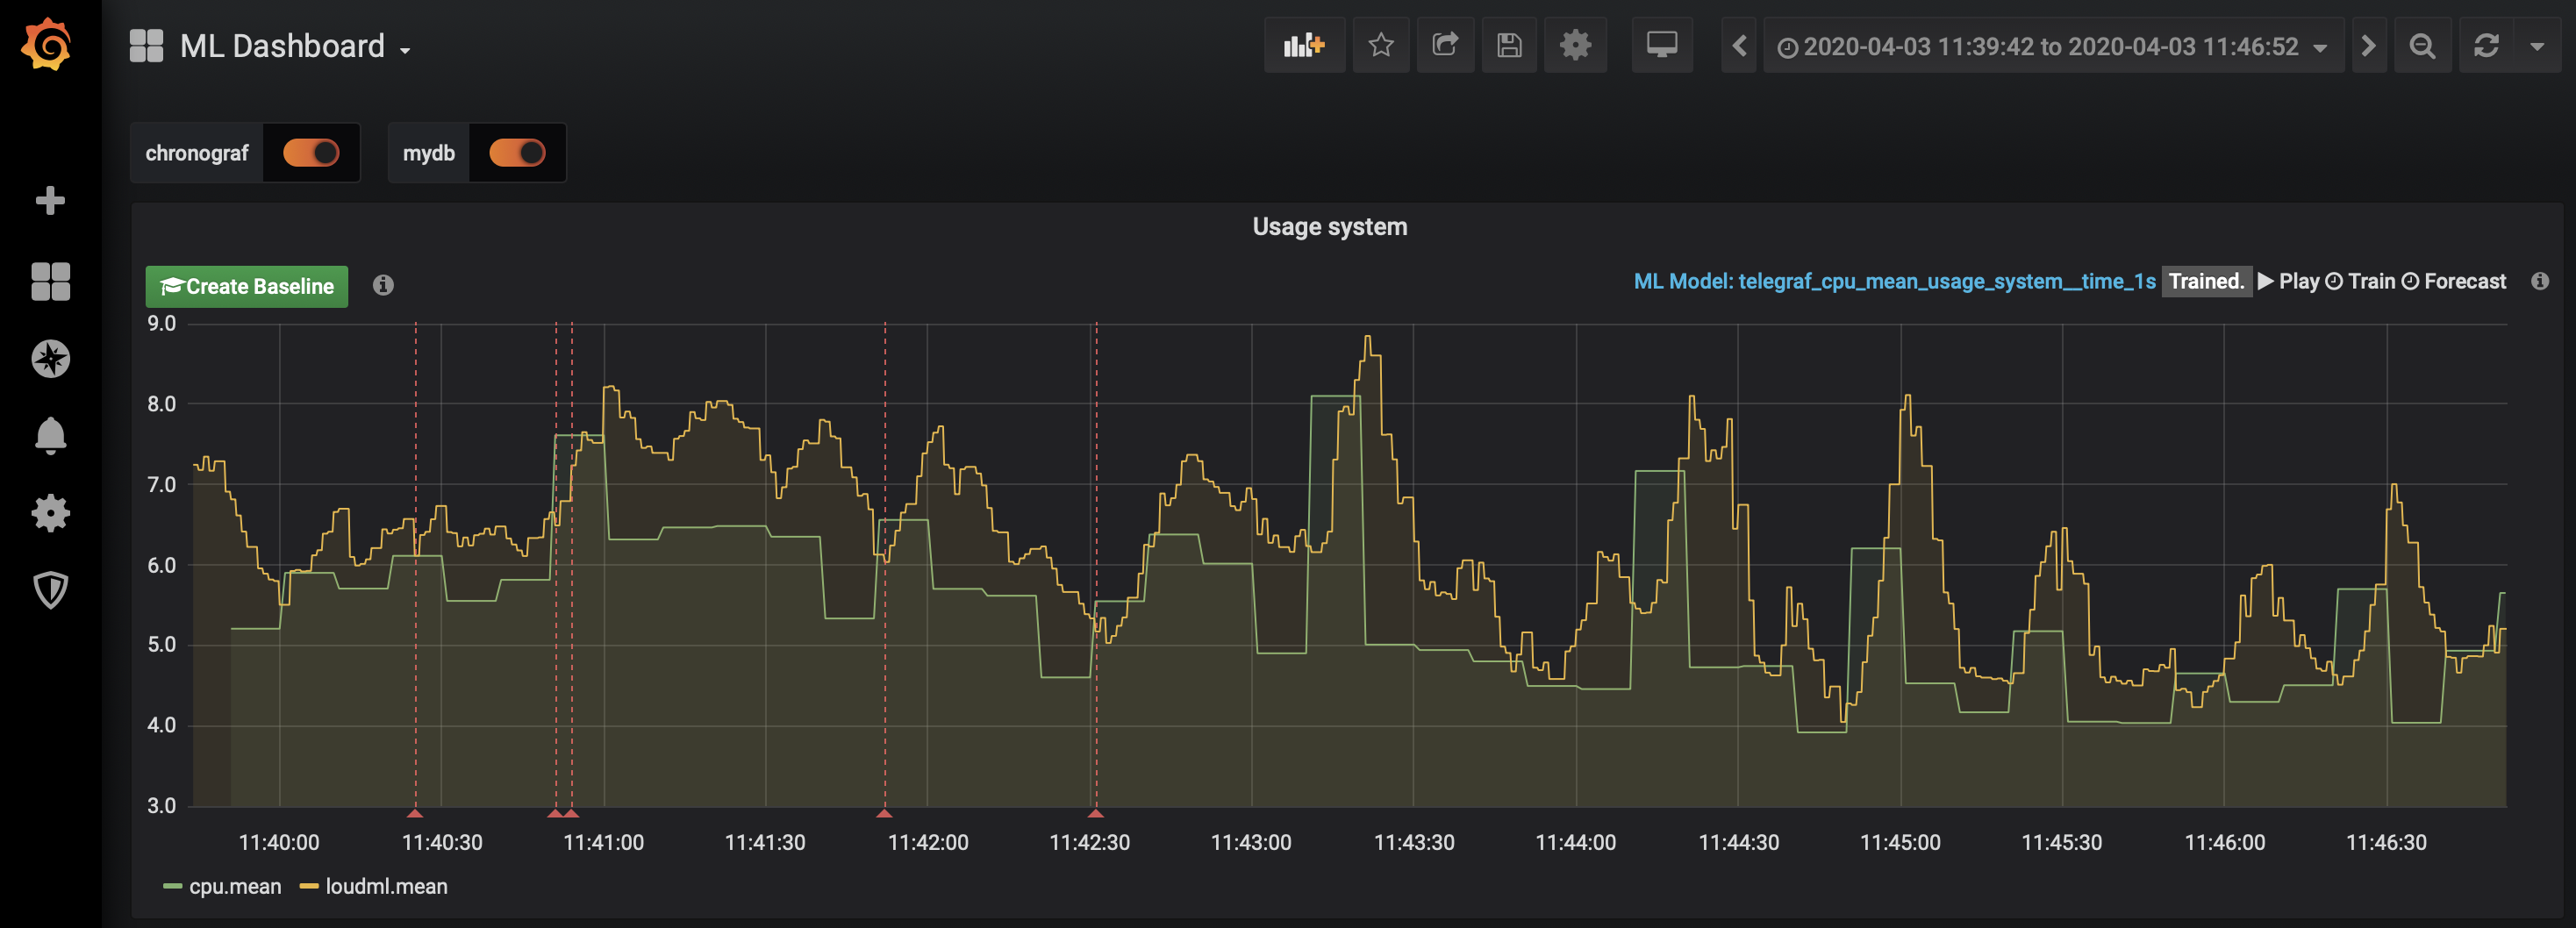
Loud ML Panel - is a version of Grafana's default Graph Panel with a "Create Baseline" button
to create ML model in 1-click.
Currently 1-click ML button ("Create Baseline") can produce model from:
* InfluxDB datasource
* OpenTSDB datasource
* Elasticsearch datasource (beta)
* Prometheus datasource (very draft)
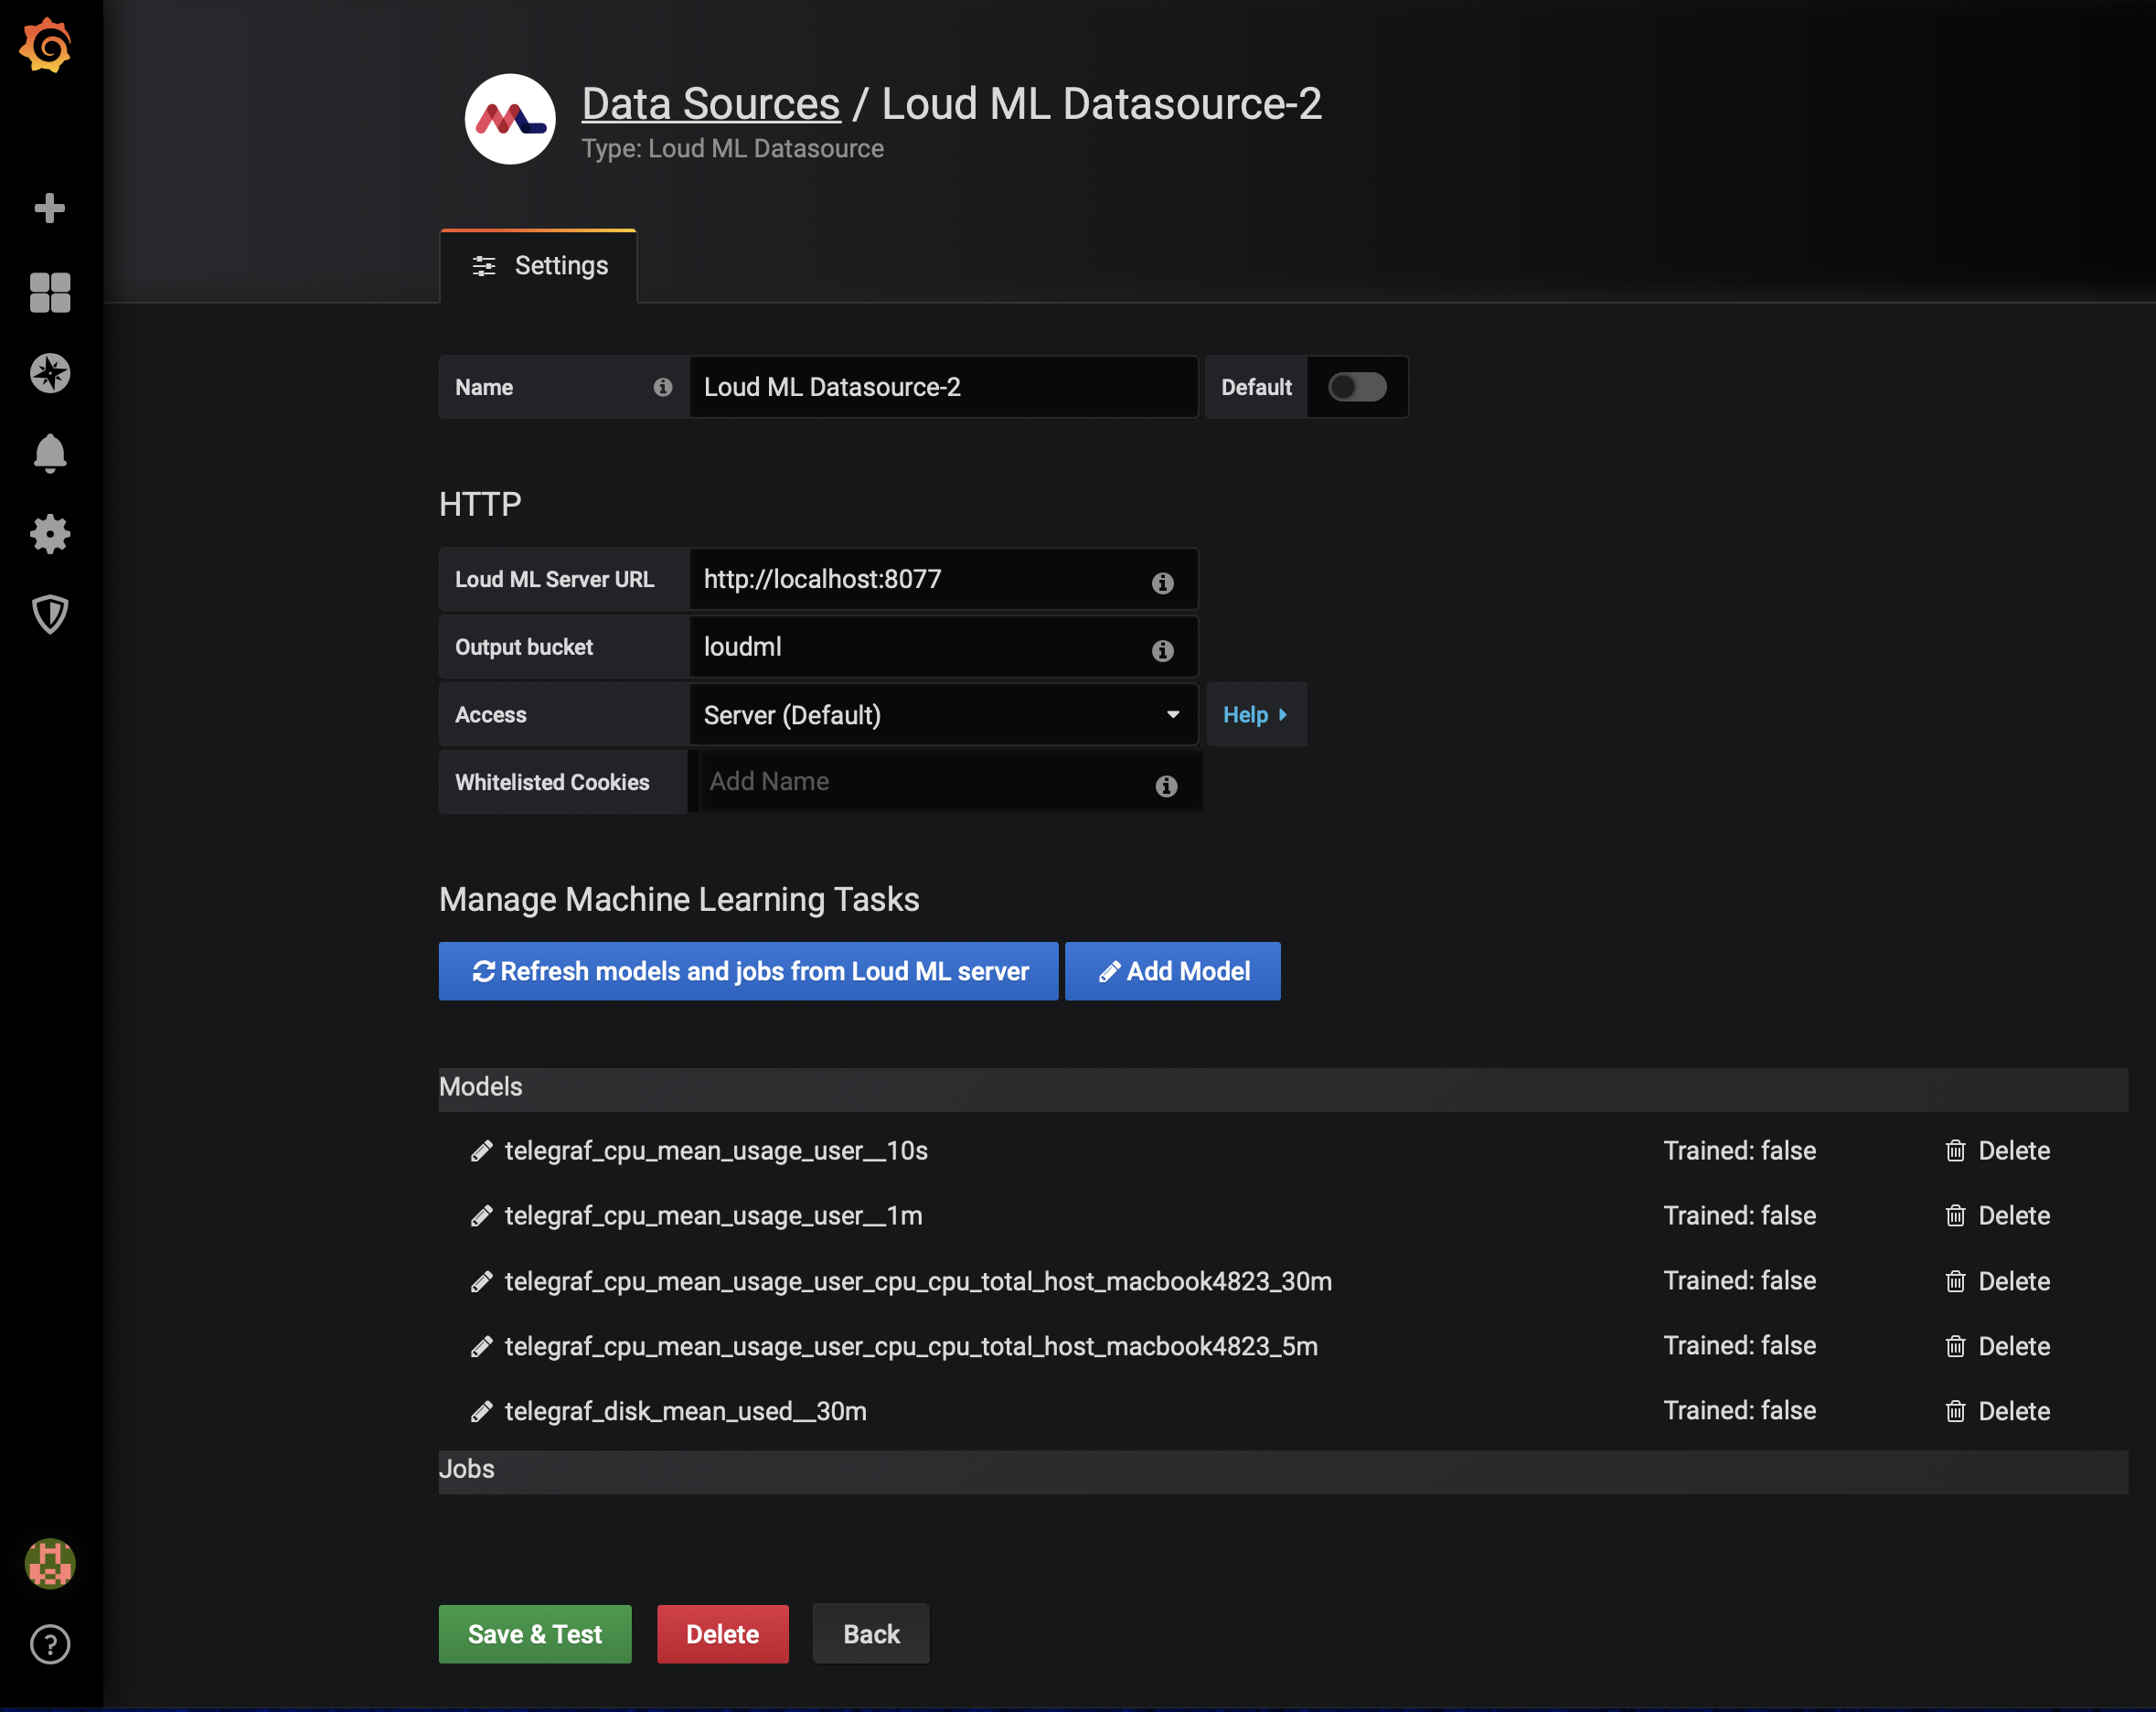
Loud ML Datasource - is a connector to Loud ML server. It has capabilities to show models and jobs on server. You can add new and edit existing models.
# Prerequisites
* Loud ML server https://github.com/regel/loudml
* Grafana >= 5.4.0
# Configuration
In order to use Loud ML with Grafana you need to have a buckets in **loudml.yml** to reflect Grafana datasource(s) used in LoudML Graph
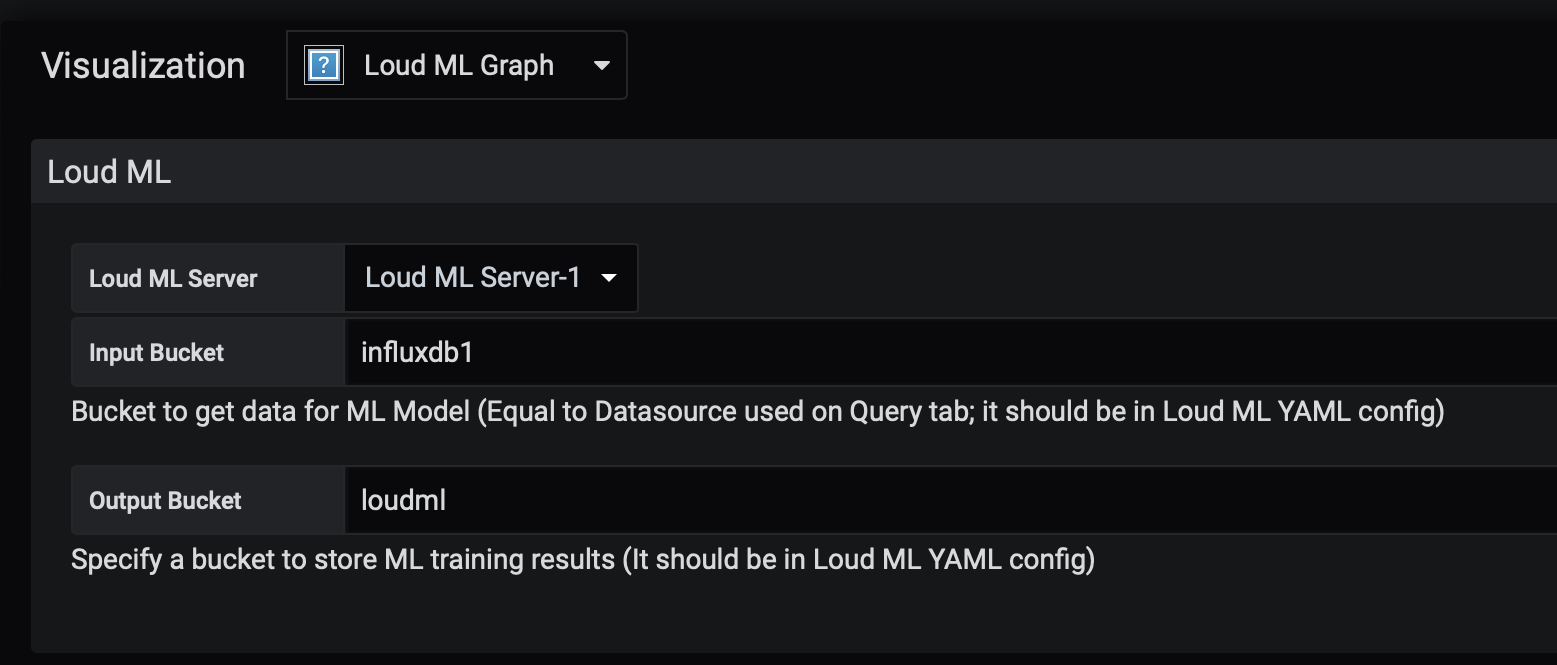
Example: I have InfluxDB datasource with **telegraf** database as an input and will use **loudml** database as output for ML model predictions/forecasting/anomalies:
buckets:
- name: loudml
type: influxdb
addr: 127.0.0.1:8086
database: loudml
retention_policy: autogen
measurement: loudml
annotation_db: loudmlannotations
- name: influxdb1
type: influxdb
addr: 127.0.0.1:8086
database: telegraf
retention_policy: autogen
measurement: loudml
- name: data
type: influxdb
addr: 127.0.0.1:8086
database: data
retention_policy: autogen
measurement: sinus
- name: opentsdb1
type: opentsdb
addr: 127.0.0.1:4242
retention_policy: autogen
- name: prom1
type: prometheus
addr: 127.0.0.1:9090
retention_policy: autogen
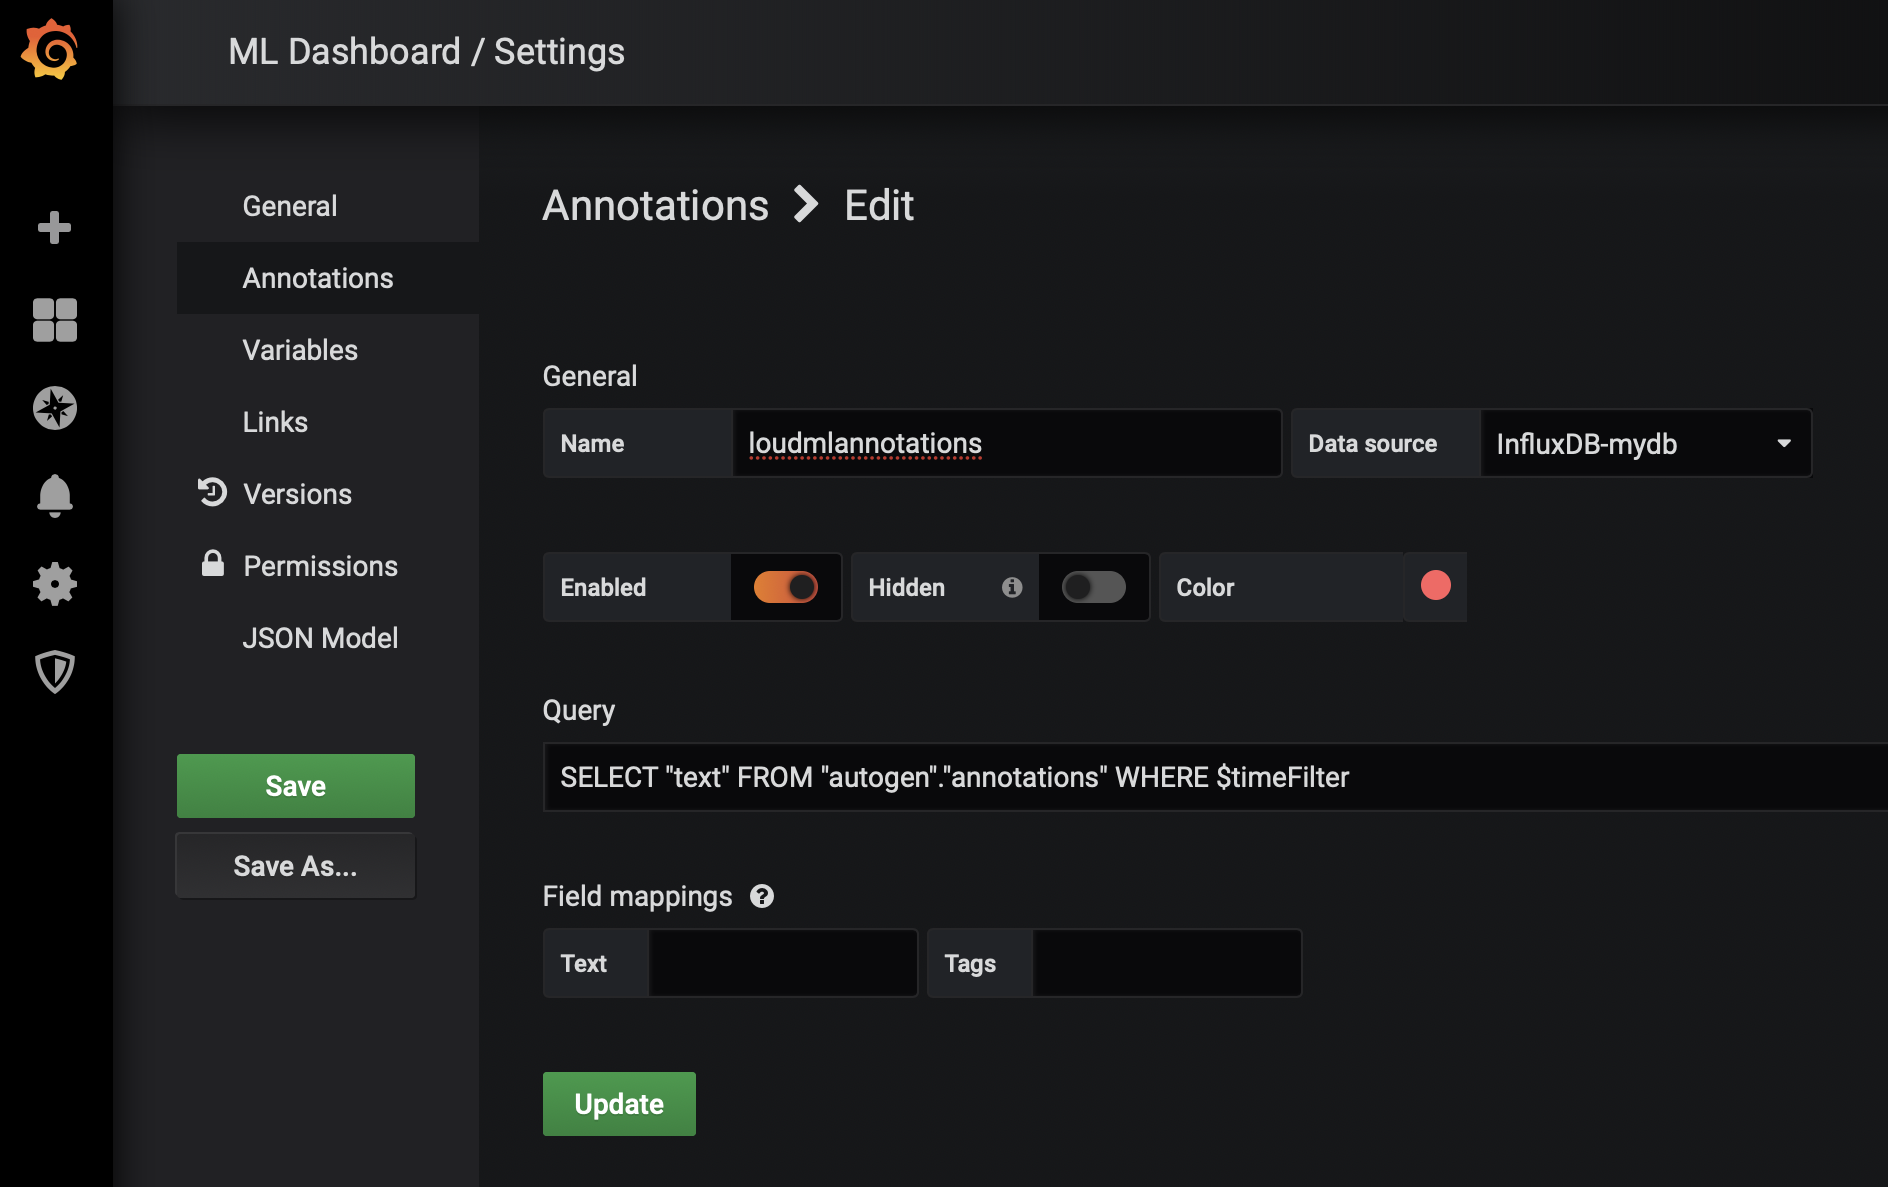
InfluxDB **loudmlannotations** here specified to store annotations. (By default Loud ML server will store annotations in **chronograf** database). So on Grafana dashboard annotations/anomalies from Loud ML should be configured as:
SELECT "text" FROM "autogen"."annotations" WHERE $timeFilter
# Support
Please post issue to tracker or contact me via vova.sergeyev at gmail.com
# Changelog
* 1.7.2 Fixed compatibility issue with Grafana 7.x
* 1.7.0dev Fixed issue with updating model on a server (#19). Fixed datasource config page in Grafana 7.x (#12).
* 1.6.0 Better Grafana 6.x compatibility. Fixed issue with output bucket.
* 1.5.0 Added capability to add and edit models on Loud ML Datasource page.
* 1.4.0 Changed ID to correct format "loudml-grafana-app"; Fixes code style follow guidelines.
* 1.3.0 Fixed issue #5 with fill(0); New capabilities: multiple metrics/features per ML model (for InfluxDB data).
* 1.2.0 New capabilities: LoudML datasource - add scheduled job; list of scheduled jobs.
* 1.1.0 Initial public release