https://github.com/wakolivotes/data-processing-and-preparation
In this tutorial, we use the Titanic Data (obtained from Kaggle) to illustrate key aspects of Data Processing and Preparation by relying on useful Python Libraries
https://github.com/wakolivotes/data-processing-and-preparation
data-science datacleaning jupyter-notebook python
Last synced: 3 months ago
JSON representation
In this tutorial, we use the Titanic Data (obtained from Kaggle) to illustrate key aspects of Data Processing and Preparation by relying on useful Python Libraries
- Host: GitHub
- URL: https://github.com/wakolivotes/data-processing-and-preparation
- Owner: wakoliVotes
- Created: 2021-08-26T11:35:32.000Z (almost 5 years ago)
- Default Branch: main
- Last Pushed: 2021-10-31T19:34:26.000Z (over 4 years ago)
- Last Synced: 2025-03-22T23:41:39.885Z (over 1 year ago)
- Topics: data-science, datacleaning, jupyter-notebook, python
- Language: Jupyter Notebook
- Homepage:
- Size: 190 KB
- Stars: 1
- Watchers: 1
- Forks: 0
- Open Issues: 0
-
Metadata Files:
- Readme: README.md
Awesome Lists containing this project
README
          ### Illustrating Data Processing and Preparation with Python Libraries

- In this tutorial, Titanic Data is used

-  This is obtained from Kaggle (Link: https://www.kaggle.com/c/titanic) to illustrate aspects of Data Processing and Preparation

- To complete this exercise, there is relying on useful Python Libraries

#### Steps and Workings

- First, there is need to import numpy and pandas, and then import the dataset for using


        import numpy as np

        import pandas as pd

          TitanicData = pd.read_csv('D:/github/Python/train.csv')  # In this section, one replaces their specific path to read the data

          TitanicData.head()                              # To visualize the data, the .head() is used to view the first five elements
The image below shows the dataset's outlook

- As seen from above, the head() keyword gives the first 5 elements. However, if you want to get a specific number of items, you can adjust by adding "n="number of rows you need"".
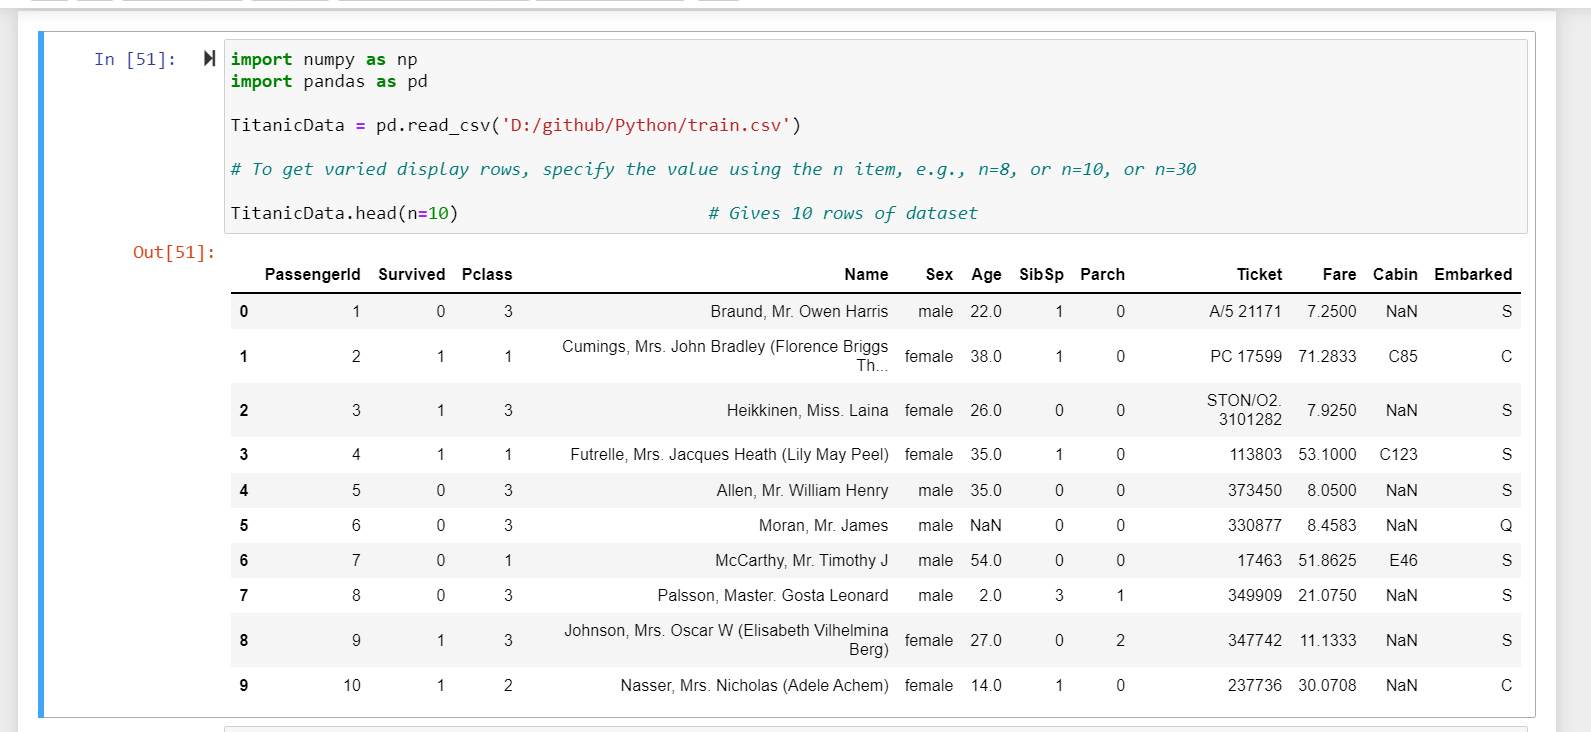
- This is illustrated below, where, to show 10 items, inside the head() function, n=10 is added, to specify the desired rows of data to show;
          import numpy as np

          import pandas as pd


          TitanicData = pd.read_csv('D:/github/Python/train.csv')


          # To get varied display rows, specify the value using the n item, e.g., n=8, or n=10, or n=30


          TitanicData.head(n=10)                        # Gives 10 rows of dataset
- The below image shows the visualization with 10 rows;
- Next, we can get more information about the Titanic data, using the info() tool, which will be coded as;
TitanicData.info() # Gives a summarized information about our dataset
- As shown, the info gives the data types of the respective columns and number of entries.
- Based on this representation, it is evident some columns have missing items, that can be examined later

- We can use the describe function to get additional information on the dataset, including its mean, mode, standard deviation, percentiles, etc. This is achieved with the code below {remember to replace the file name, i.e., TitanicData, with your respective data file name}
TitanicData.describe() # Gives additional descriptive statistics information about our dataset
Below is the describe output for the used dataset
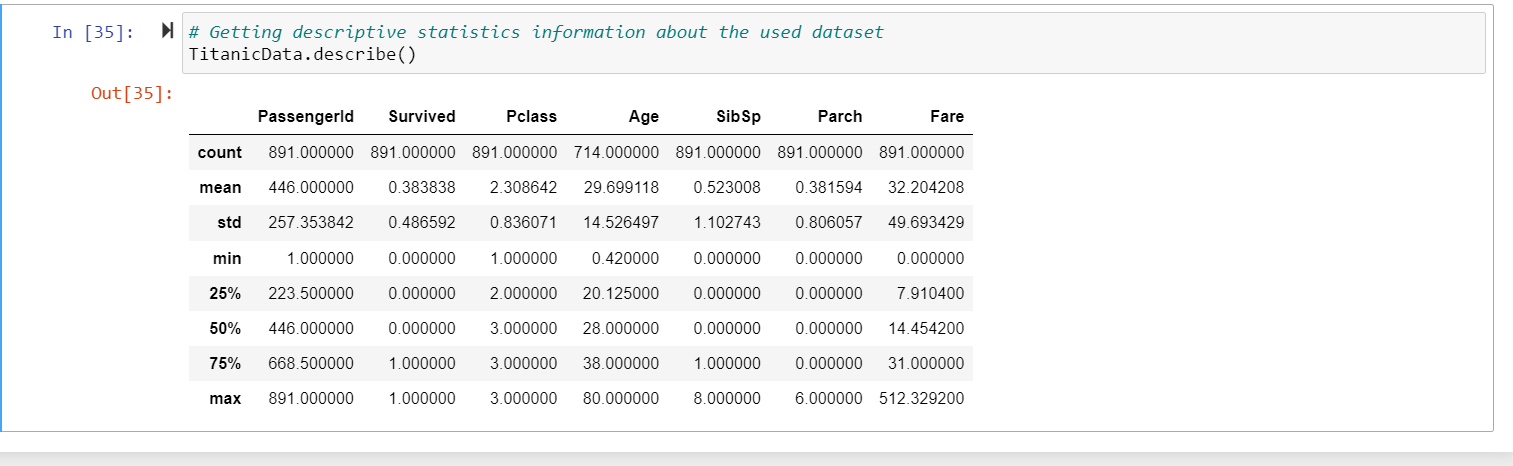
- As shown from above, we can see that for the TitanicData, basic descriptive statistics can help us understand the data more.
- For example, from the data, the mean values are evident. In the sample, we can see the means of;
        - Passengers, i.e., PassengerId (446.00),

        - Survived (0.383838),

        - Pclass (2.308642),

        - Age (29.699118),

        - SibSp (0.523008),

        - Parch (0.381594) and,

        - Fare (32.204208).
- NOTE: The above describe() function only gives columns that have continuous data elements, while there is excluding caterorical data.
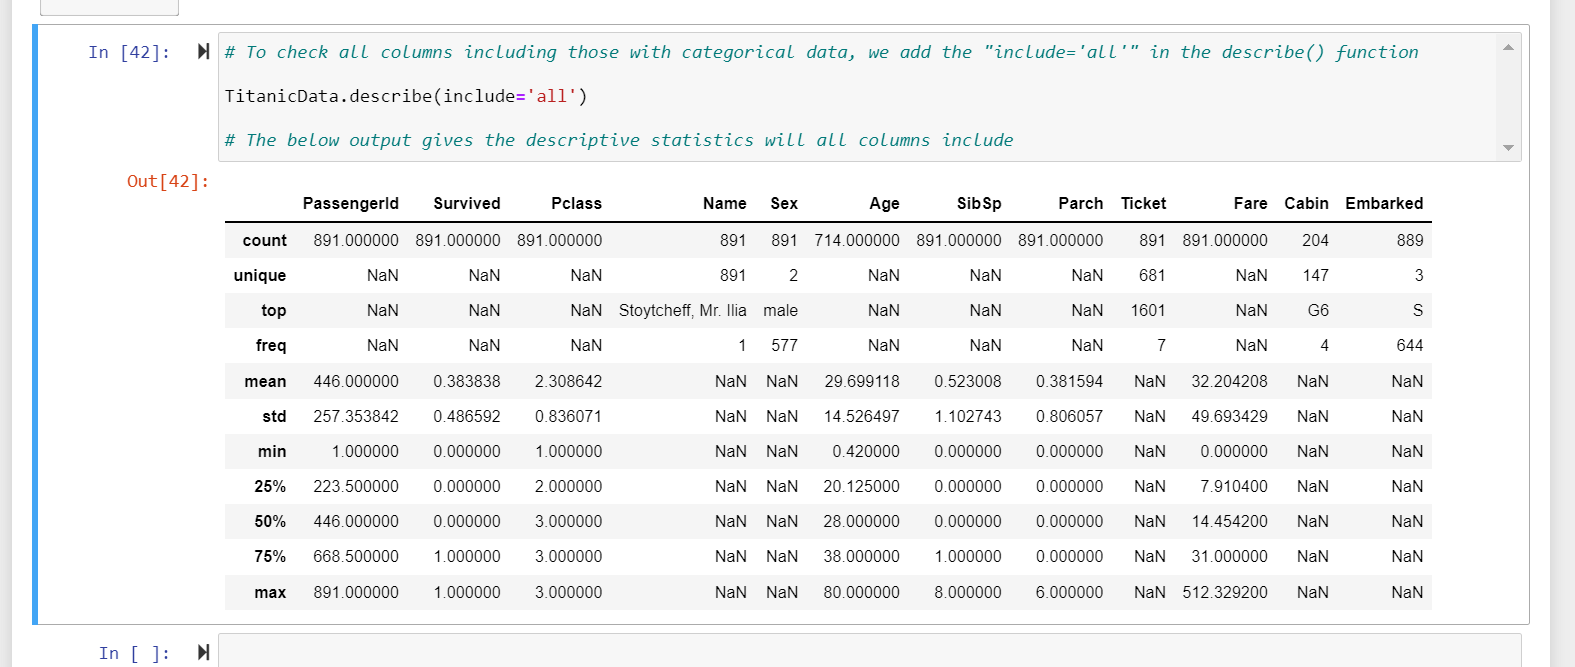
- However, if you need to include everything, you can add the "(include='all')" after writing the describe() function.
- This is as illustrated below;
TitanicData.describe(include='all') # Gives descriptive statistics for all columns
Below is now the outlook for all columns in the dataset;