https://github.com/walshc/voronoi
R package to create a shapefile of a voronoi diagram from given points
https://github.com/walshc/voronoi
Last synced: 2 days ago
JSON representation
R package to create a shapefile of a voronoi diagram from given points
- Host: GitHub
- URL: https://github.com/walshc/voronoi
- Owner: walshc
- License: gpl-2.0
- Created: 2018-03-29T19:31:05.000Z (over 7 years ago)
- Default Branch: master
- Last Pushed: 2018-03-31T14:55:31.000Z (over 7 years ago)
- Last Synced: 2024-08-06T03:03:26.306Z (11 months ago)
- Language: R
- Size: 180 KB
- Stars: 5
- Watchers: 3
- Forks: 0
- Open Issues: 0
-
Metadata Files:
- Readme: README.md
- License: LICENSE
Awesome Lists containing this project
README
        # voronoi

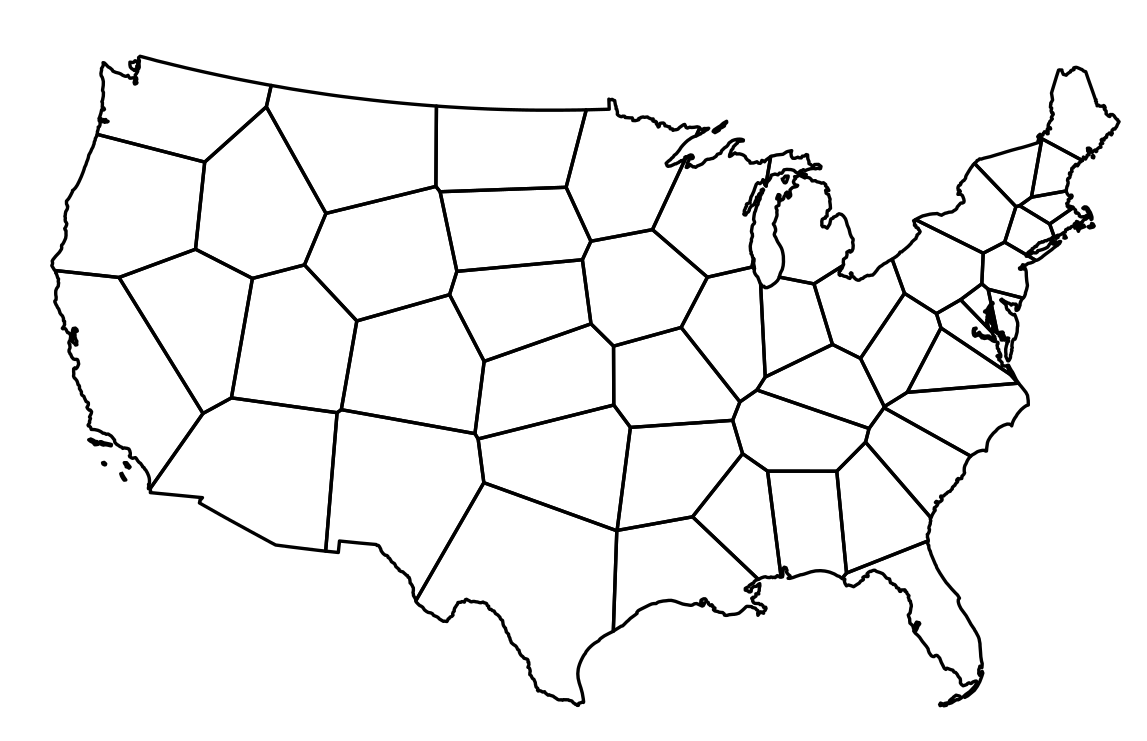
An `R` package to output a `SpatialPolygonsDataFrame` (a shapefile) of the voronoi diagram of given points, bounded by a surrounding shapefile. This is useful, for example, if you only have the centroids of various areas and not the corresponding shapefile. The voronoi diagram can serve as an approximation.

## Installation

```r

if (!require(devtools)) install.packages("devtools")

devtools::install_github("walshc/voronoi")

```

## Example Usage

Suppose we only have the centroids of each of the contiguous US states and want to use the voronoi diagram as an approximation.

Download, extract and load a shapefile of US states:

```r

file <- "http://www2.census.gov/geo/tiger/GENZ2015/shp/cb_2015_us_state_20m.zip"

download.file(file, "states.zip")

unzip("states.zip")

shp <- rgdal::readOGR(".", "cb_2015_us_state_20m")

shp <- shp[!(shp@data$STATEFP %in% c("02", "15", "72")),]  # Contiguous US

shp <- sp::spTransform(shp, CRS("+init=epsg:26978"))

```

Get the centroids of the states as our points:

```r

crds <- sp::coordinates(shp)

```

To use the function, give it the longitudes, latitudes and the bounding shapefile:

```r

voronoi <- voronoiShapefile(lon = crds[, 1], lat = crds[, 2], shp = shp)

```

The resulting shapefile looks like this:


You can export as a shapefile for use in other software as follows:

```r

rgdal::writeOGR(voronoi, dsn = ".", driver = "ESRI Shapefile",

                layer = "voronoi-states", overwrite_layer = TRUE)

```