https://github.com/wapiflapi/villoc
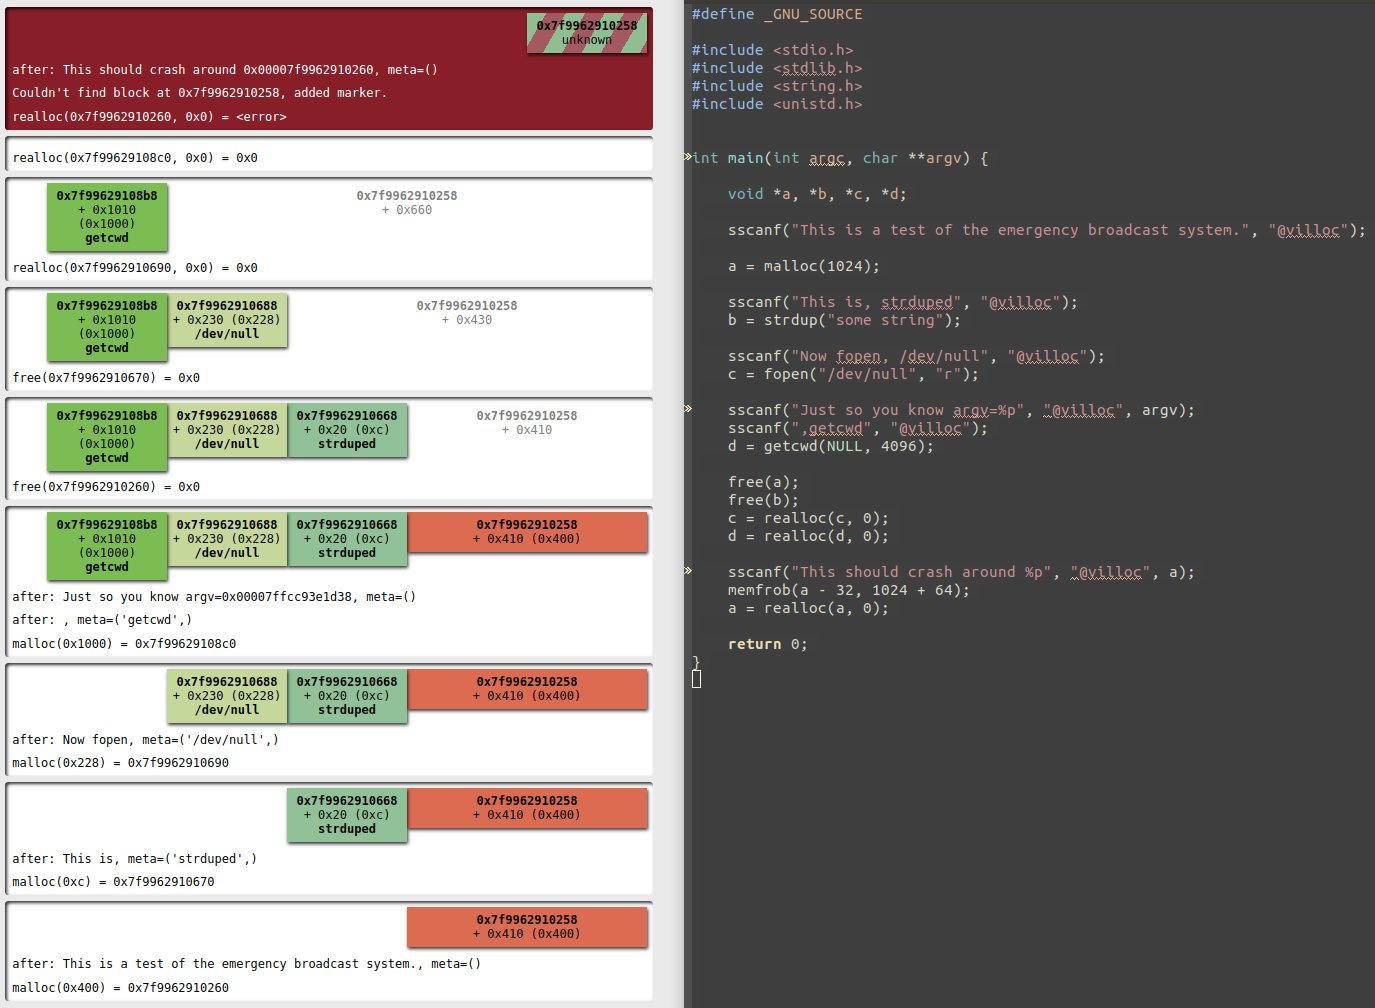
Visualization of heap operations.
https://github.com/wapiflapi/villoc
Last synced: 3 months ago
JSON representation
Visualization of heap operations.
- Host: GitHub
- URL: https://github.com/wapiflapi/villoc
- Owner: wapiflapi
- License: mit
- Created: 2015-04-19T13:41:10.000Z (almost 11 years ago)
- Default Branch: master
- Last Pushed: 2024-12-05T10:57:58.000Z (over 1 year ago)
- Last Synced: 2025-04-02T05:44:12.691Z (about 1 year ago)
- Language: Python
- Size: 50.8 KB
- Stars: 607
- Watchers: 32
- Forks: 71
- Open Issues: 5
-
Metadata Files:
- Readme: README.md
- License: LICENSE.md
Awesome Lists containing this project
- awesome-rainmana - wapiflapi/villoc - Visualization of heap operations. (Python)
- awesome-csirt - Villoc
README
# Villoc
Villoc is a heap visualisation tool, it's a python script that renders a static
html file. An example can be seen here: http://wapiflapi.github.io/villoc/, this
is villoc running on an exploit of PlaidCTF 2015's challenge PlaidDB.
## How to
The easiest way to use villoc is probably to run the following command and open
out.html in a browser.
```shell
ltrace ./target |& villoc.py - out.html;
```
It is probably a good idea to disable ASLR for repeatable results and to use a
file to pass the ltrace to villoc because otherwise the target's error output
will be interleaved and might confuse villoc sometimes.
```shell
setarch x86_64 -R ltrace -o trace ./target; villoc.py trace out.html;
```
## Using DynamoRIO
The problem with ltrace is that it doesn't track calls to malloc from
other libraries or from within libc itself.
Please check https://github.com/wapiflapi/villoc/tree/master/tracers/dynamorio
for (easy!) instructions for using a DynamoRIO tool to achieve full tracing.
## Annotations
Villoc's input should look like ltrace's output, other tracers should output
compatible logs. Villoc also listens to annotations of the following form:
``` text
@villoc(comma separated annotations) = `
```
When using this it's possible to mark certain block as being significant which
makes analyzing villoc's output that much easier.
### Annotations from C code through DynamoRIO.
When using the dynamorio tracer there is a hack to easily inject annotations
from a target's source code:
``` C
sscanf("Format string %d %d, FOO %s", "@villoc", 1, 2, "BAR");
```
Will inject `Format string 1 2` into villoc's log and add the `FOO`
and `BAR` tags to the block affected by the next memory operation.

## Which malloc
This has been made with glibc's dl_malloc in mind. But it should work for other
implementations, especially if you play with the `--header` and `--footer`
options to indicate how much overhead the targeted malloc adds to the user data.