https://github.com/wendigo/chrome-protocol-proxy
Chrome DevTools Protocol Proxy - intelligent proxy for debugging purposes
https://github.com/wendigo/chrome-protocol-proxy
chrome chrome-browser chrome-devtools chromedriver chromium debugging-tool proxy
Last synced: over 1 year ago
JSON representation
Chrome DevTools Protocol Proxy - intelligent proxy for debugging purposes
- Host: GitHub
- URL: https://github.com/wendigo/chrome-protocol-proxy
- Owner: wendigo
- License: mit
- Created: 2017-04-17T08:49:07.000Z (over 9 years ago)
- Default Branch: master
- Last Pushed: 2025-01-31T09:09:45.000Z (over 1 year ago)
- Last Synced: 2025-03-28T13:11:08.212Z (over 1 year ago)
- Topics: chrome, chrome-browser, chrome-devtools, chromedriver, chromium, debugging-tool, proxy
- Language: Go
- Homepage:
- Size: 123 KB
- Stars: 206
- Watchers: 7
- Forks: 27
- Open Issues: 1
-
Metadata Files:
- Readme: README.md
- License: LICENSE
Awesome Lists containing this project
- fucking-awesome-chrome-devtools - Chrome Protocol Proxy - Tool for debugging clients using devtools protocol. (Chrome DevTools Protocol / Developing with the protocol)
- awesome-chrome-devtools - Chrome Protocol Proxy - Tool for debugging clients using devtools protocol. (Chrome DevTools Protocol / Developing with the protocol)
README
# chrome-protocol-proxy
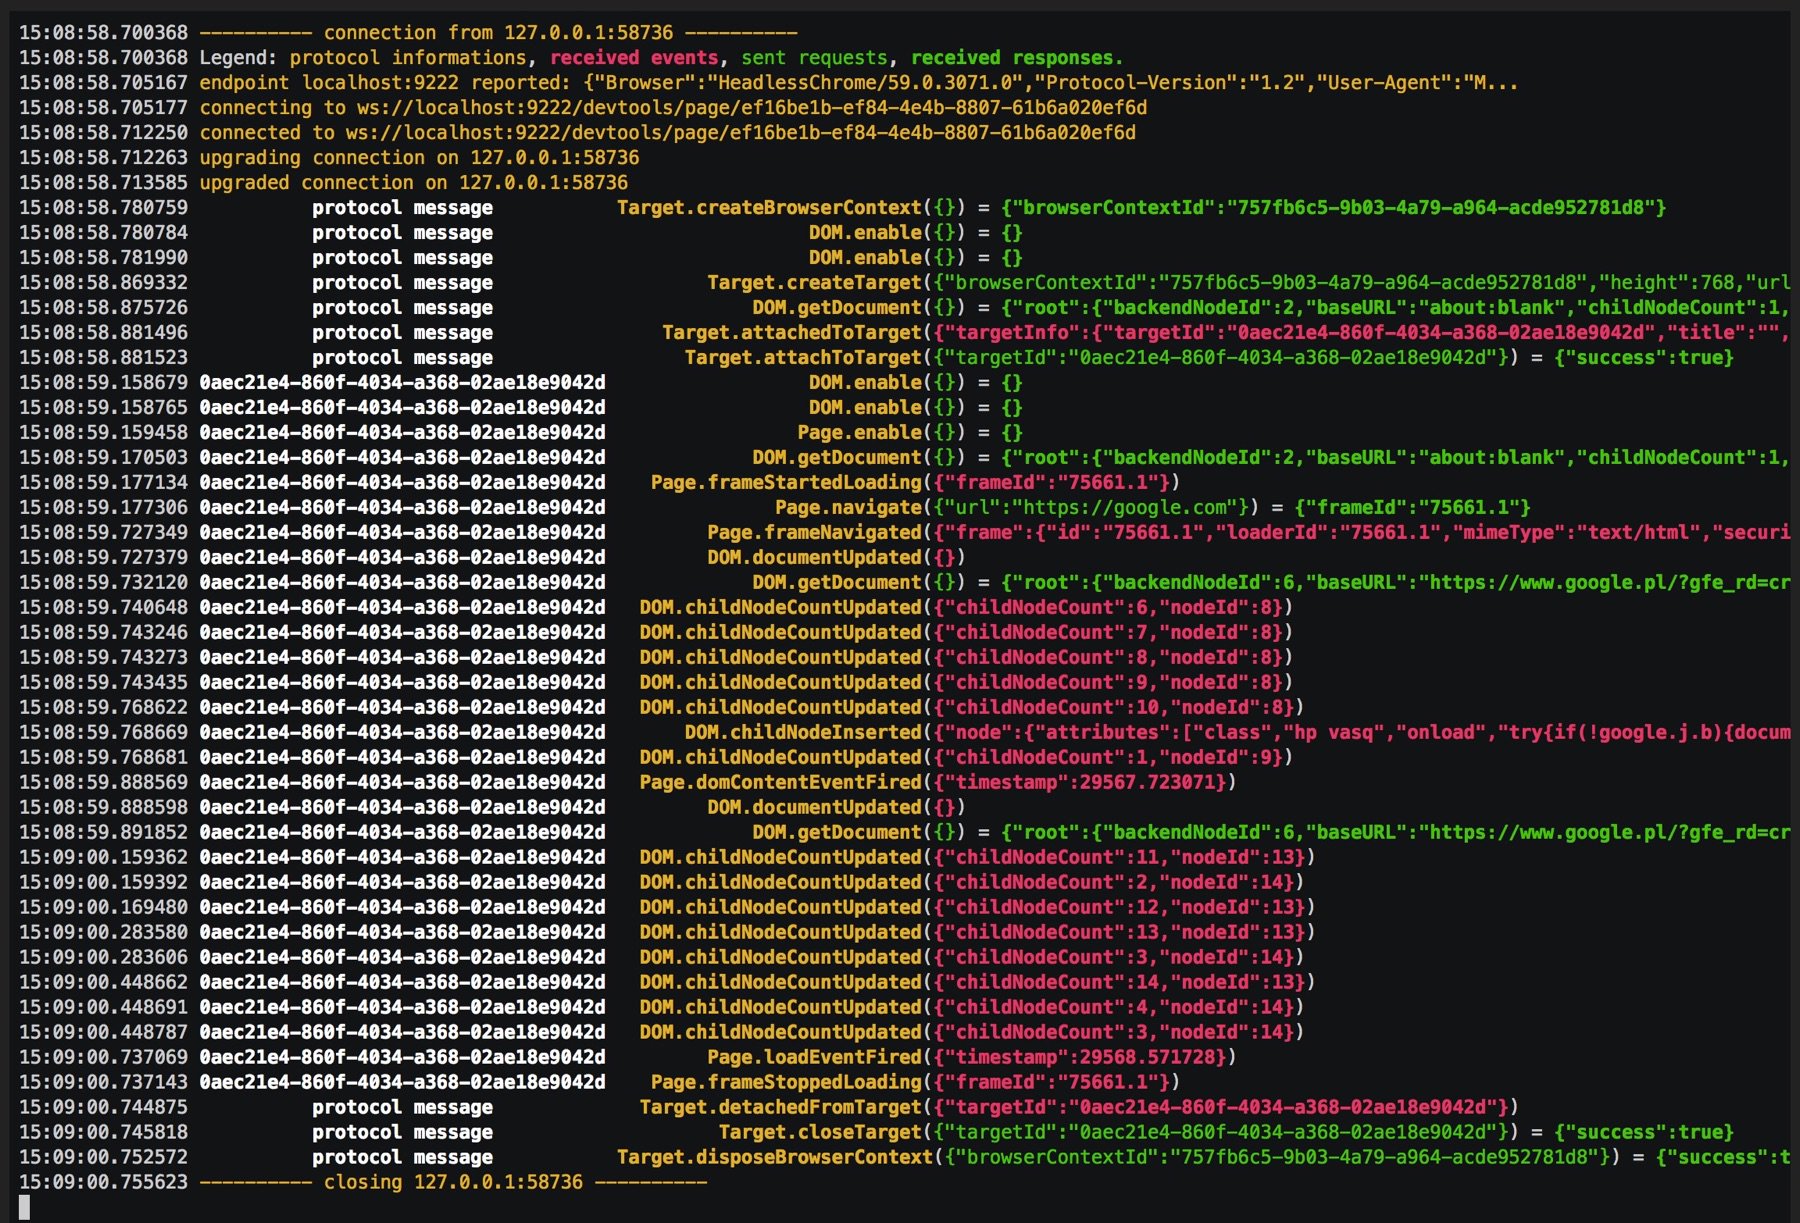
```chrome-protocol-proxy``` is small, reverse proxy designed for working with [Chrome's DevTools protocol](https://github.com/ChromeDevTools/devtools-protocol). It captures all commands sent to and events received from Chrome, coalesce requests with responses, unpack messages from [Target domain](https://chromedevtools.github.io/debugger-protocol-viewer/tot/Target/) and provide easy to read, colored output. This tool is a fork of (and heavily inspired by) [chromedp-proxy](https://github.com/chromedp/chromedp-proxy).
# Installation
## Via homebrew
```brew install wendigo/tap/chrome-protocol-proxy```
## Via go get
```go get -u github.com/wendigo/chrome-protocol-proxy```
## Via docker
```docker run -t -i -p 9222:9222 wendigo/chrome-protocol-proxy:latest```
This image bundles headless Chrome in the latest version so debugger is ready to use (head to [http://localhost:9222](http://localhost:9222) to validate).
# Features
- colored output,
- protocol frames filtering,🖖
- request-response coalescing,
- interprets [Target.sendMessageToTarget](https://chromedevtools.github.io/debugger-protocol-viewer/tot/Target/#method-sendMessageToTarget) requests,
- interprets [Target.receivedMessageFromTarget](https://chromedevtools.github.io/debugger-protocol-viewer/tot/Target/#event-receivedMessageFromTarget) responses and events with [sessionId](https://chromium.googlesource.com/chromium/src/+/237f82767da3bbdcd8d6ad3fa4449ef6a3fe8bd3),
- understands flatted sessions ([crbug.com/991325](https://bugs.chromium.org/p/chromium/issues/detail?id=991325))
- calculates and displays time delta between consecutive frames,
- writes logs and splits them based on connection id and target/session id.
# Configuration flags
```
-d write logs file per targetId
-delta
show delta time between log entries
-exclude value
exclude requests/responses/events matching pattern (default exclude = )
-force-color
force color output regardless of TTY
-i include request frames as they are sent
-include value
display only requests/responses/events matching pattern (default include = )
-l string
listen address (default "localhost:9223")
-log-dir string
logs directory (default "logs")
-m display time in microseconds
-once
debug single session
-q do not show logs on stdout
-r string
remote address (default "localhost:9222")
-s max_length
shorten requests and responses to max_length
-version
display version information
```
# Demo
[](https://asciinema.org/a/113947?t=0:04&autoplay=1&speed=0.4)