https://github.com/whitead/skunk
Insert SVG images into matplotlib elements. Can be used to also compose matplotlib plots by nesting them.
https://github.com/whitead/skunk
matplotlib python svg
Last synced: 11 months ago
JSON representation
Insert SVG images into matplotlib elements. Can be used to also compose matplotlib plots by nesting them.
- Host: GitHub
- URL: https://github.com/whitead/skunk
- Owner: whitead
- License: mit
- Created: 2021-09-04T18:25:54.000Z (almost 5 years ago)
- Default Branch: main
- Last Pushed: 2023-11-27T17:17:35.000Z (over 2 years ago)
- Last Synced: 2024-12-10T07:11:22.912Z (over 1 year ago)
- Topics: matplotlib, python, svg
- Language: Python
- Homepage:
- Size: 48.8 KB
- Stars: 74
- Watchers: 4
- Forks: 7
- Open Issues: 3
-
Metadata Files:
- Readme: README.md
- License: LICENSE
Awesome Lists containing this project
README
# skunk [](https://whitead.github.io/skunk/)[](https://badge.fury.io/py/skunk)
Insert SVG images into matplotlib elements. Can be used to also compose matplotlib plots by nesting them.
```sh
pip install skunk
```
## Jupyter Notebooks
To show generated SVGs in Jupyter Notebooks:
```py
skunk.display(svg)
```
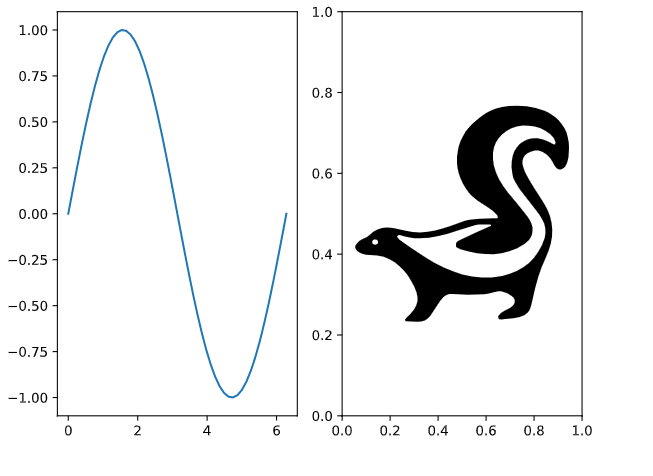
## Overwrite Subplot
```py
import skunk
import numpy as np
import os
import matplotlib.pyplot as plt
fig, axs = plt.subplots(ncols=2)
x = np.linspace(0, 2 * np.pi)
axs[0].plot(x, np.sin(x))
# important line where we set ID
skunk.connect(axs[1], 'sk')
plt.tight_layout()
# Overwrite using file path to my svg
# Can also use a string that contains the SVG
svg = skunk.insert(
{
'sk': 'skunk.svg'
})
# write to file
with open('replaced.svg', 'w') as f:
f.write(svg)
# or in jupyter notebook
skunk.display(svg)
```
### Output
## SVG in Annotation
Read about [annotation boxes first](https://matplotlib.org/stable/gallery/text_labels_and_annotations/demo_annotation_box.html)
```py
import skunk
from matplotlib.offsetbox import AnnotationBbox
import numpy as np
import matplotlib.pyplot as plt
fig, ax = plt.subplots()
x = np.linspace(0, 2 * np.pi)
ax.plot(x, np.sin(x))
# new code: using skunk box with id sk1
box = skunk.Box(50, 50, 'sk1')
ab = AnnotationBbox(box, (np.pi / 2, 1),
xybox=(-5, -100),
xycoords='data',
boxcoords='offset points',
arrowprops=dict(arrowstyle="->"))
ax.add_artist(ab)
# sknunk box with id sk2
box = skunk.Box(50, 50, 'sk2')
ab = AnnotationBbox(box, (3 * np.pi / 2, -1),
xybox=(-5, 100),
xycoords='data',
boxcoords='offset points',
arrowprops=dict(arrowstyle="->"))
ax.add_artist(ab)
# insert current figure into itself at sk1
# insert svg file in sk2
svg = skunk.insert(
{
'sk1': skunk.pltsvg(),
'sk2': 'skunk.svg'
})
# write to file
with open('replaced2.svg', 'w') as f:
f.write(svg)
# or in jupyter notebook
skunk.display(svg)
```
### Output

## SVG to Replace Image
Sometimes you may want a raster image to appear if not using an SVG. This can be done with an `ImageBox`.
The example above is identical, except we replace the `skunk.Box` with a `skunk.ImageBox` that has the same
arguments (after first) as [`OffsetImage`](https://matplotlib.org/stable/api/offsetbox_api.html#matplotlib.offsetbox.OffsetImage)
```py
# use image box, so can have PNG when not in SVG
with open('skunk.png', 'rb') as file:
skunk_img = plt.imread(file)
box = skunk.ImageBox('sk2', skunk_img, zoom=0.1)
```
### Output
You can see that the inner image contains the raster now instead of the blue rectangle. This example is overly fancy, normally you won't be *recursively* nesting plots so the raster image will only appear if you're not using SVG.

## Save to PDF
I prefer [`cairosvg`](https://github.com/Kozea/CairoSVG):
```py
import cairosvg
cairosvg.svg2pdf(bytestring=svg, write_to='image.pdf')
```
## Layout a set of SVGs
Sometimes you just want to slap a bunch of SVGs together into a grid. You can do that with this method:
```py
svg = skunk.layout_svgs(svgs)
```