https://github.com/willyelm/xatom-debug
A Simple Debugger Provider for Atom
https://github.com/willyelm/xatom-debug
atom breakpoints debugbar debugger debugging-tool google-chrome javascript nodejs
Last synced: 5 months ago
JSON representation
A Simple Debugger Provider for Atom
- Host: GitHub
- URL: https://github.com/willyelm/xatom-debug
- Owner: willyelm
- License: mit
- Created: 2017-03-15T02:05:10.000Z (over 9 years ago)
- Default Branch: master
- Last Pushed: 2021-06-05T17:51:29.000Z (about 5 years ago)
- Last Synced: 2025-04-10T20:27:54.970Z (over 1 year ago)
- Topics: atom, breakpoints, debugbar, debugger, debugging-tool, google-chrome, javascript, nodejs
- Language: TypeScript
- Homepage:
- Size: 2.24 MB
- Stars: 71
- Watchers: 3
- Forks: 5
- Open Issues: 27
-
Metadata Files:
- Readme: README.md
- Changelog: CHANGELOG.md
- License: LICENSE.md
Awesome Lists containing this project
README
# XAtom Debug
[](https://gitter.im/willyelm/xatom-debug?utm_source=badge&utm_medium=badge&utm_campaign=pr-badge&utm_content=badge)
[](https://atom.io/packages/xatom-debug)
[](https://github.com/willyelm/atom-bug/blob/master/LICENSE.md)
A Simple Debugging tool for Atom. `xatom-debug` is a base debugger UI provider, you will need additionally install a specific debugger for your language.
### Installation
```
apm install xatom-debug
```
### Features
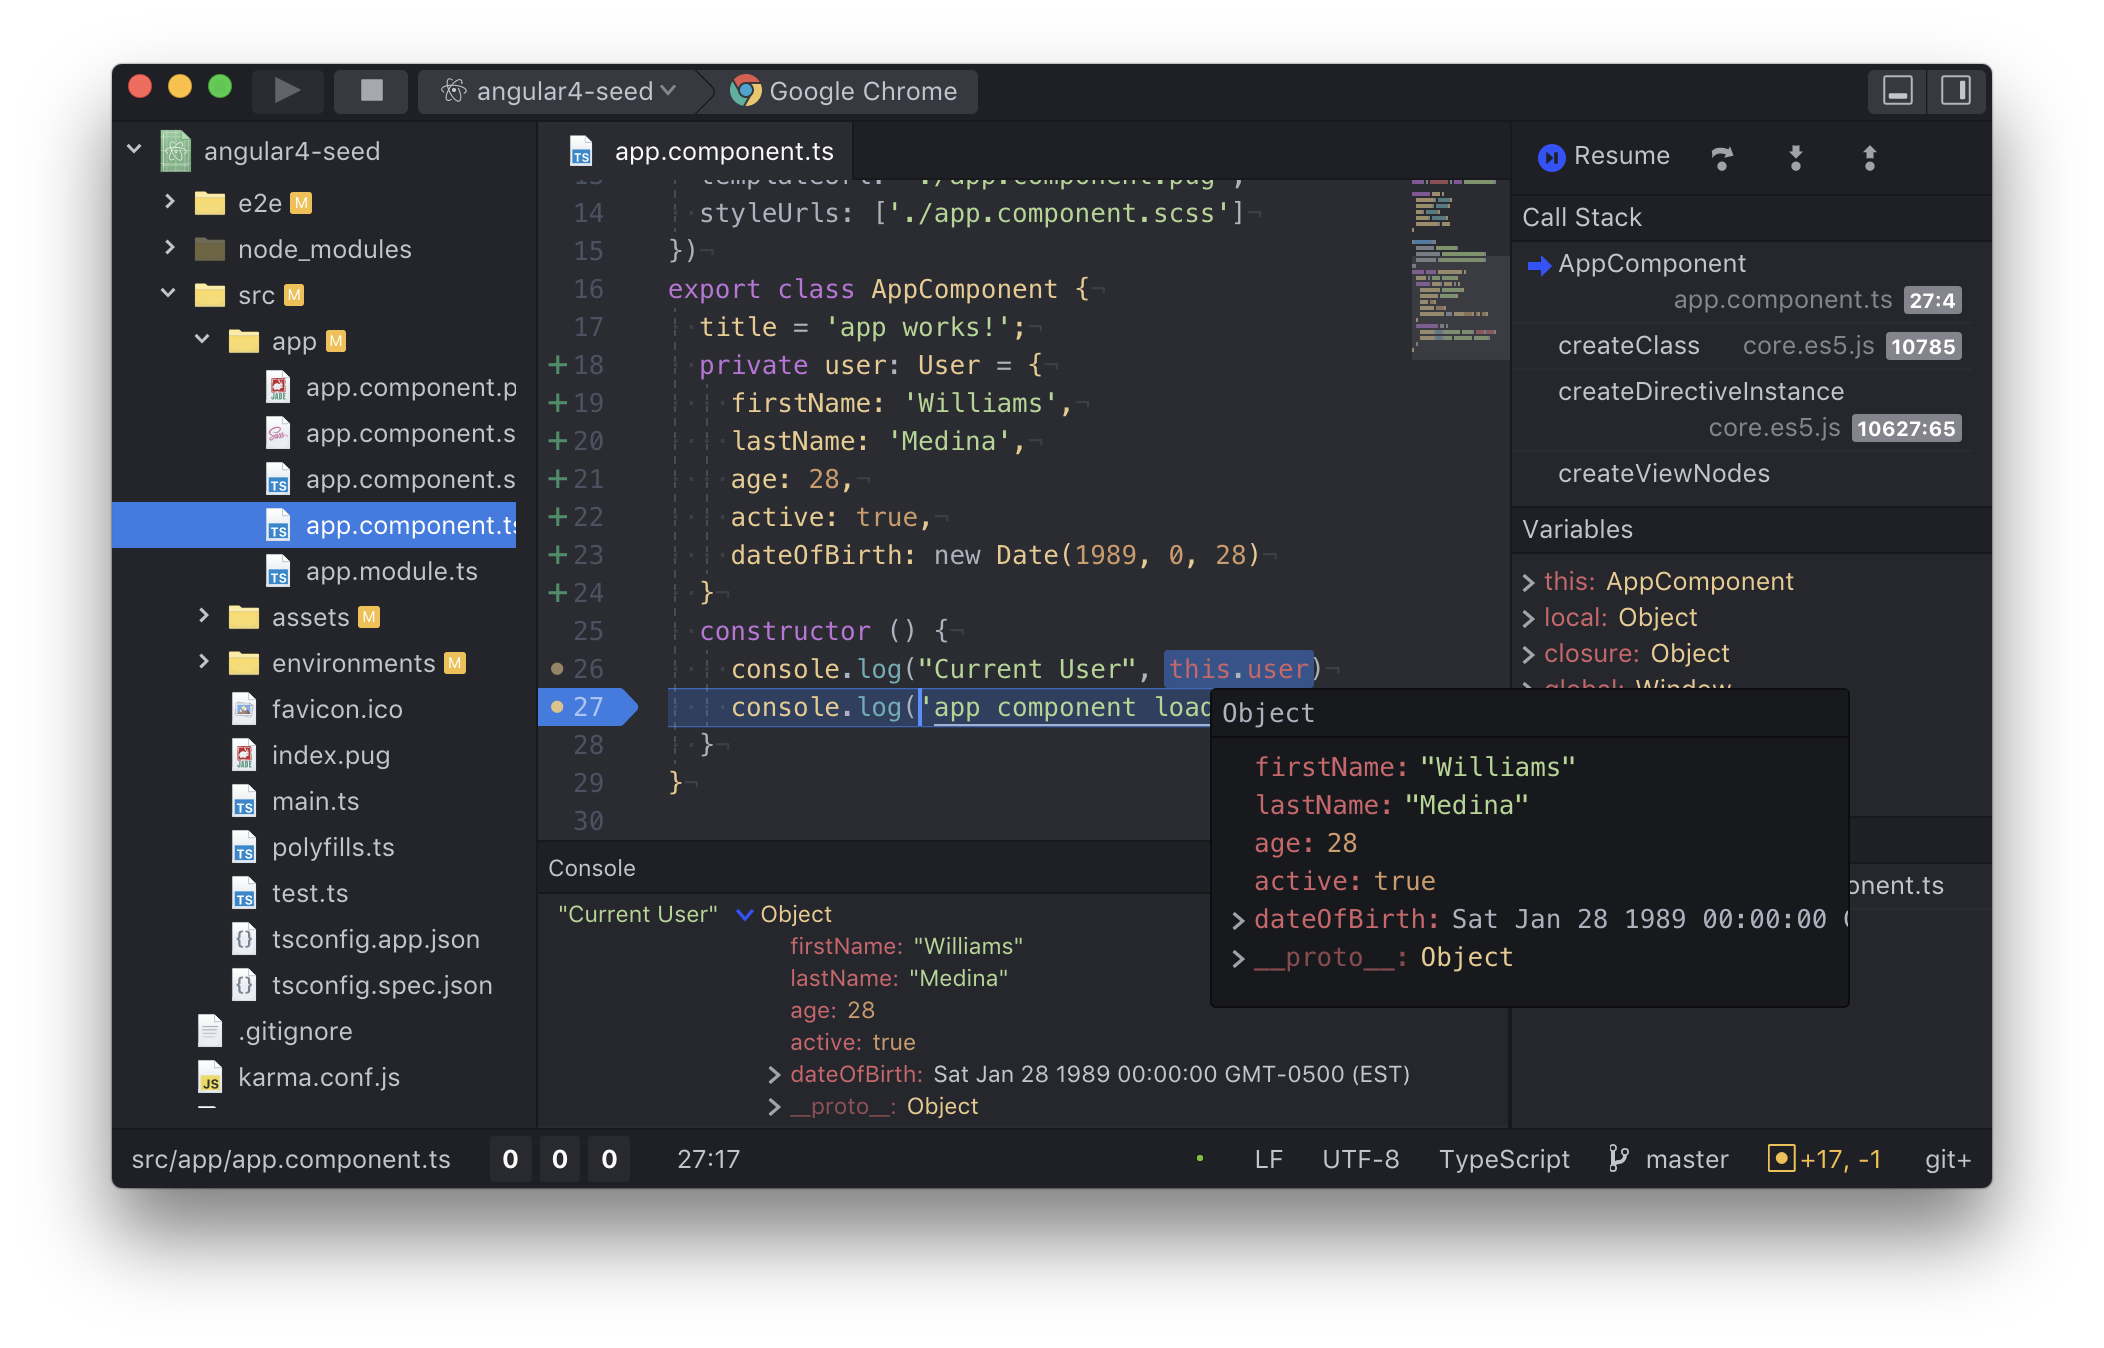
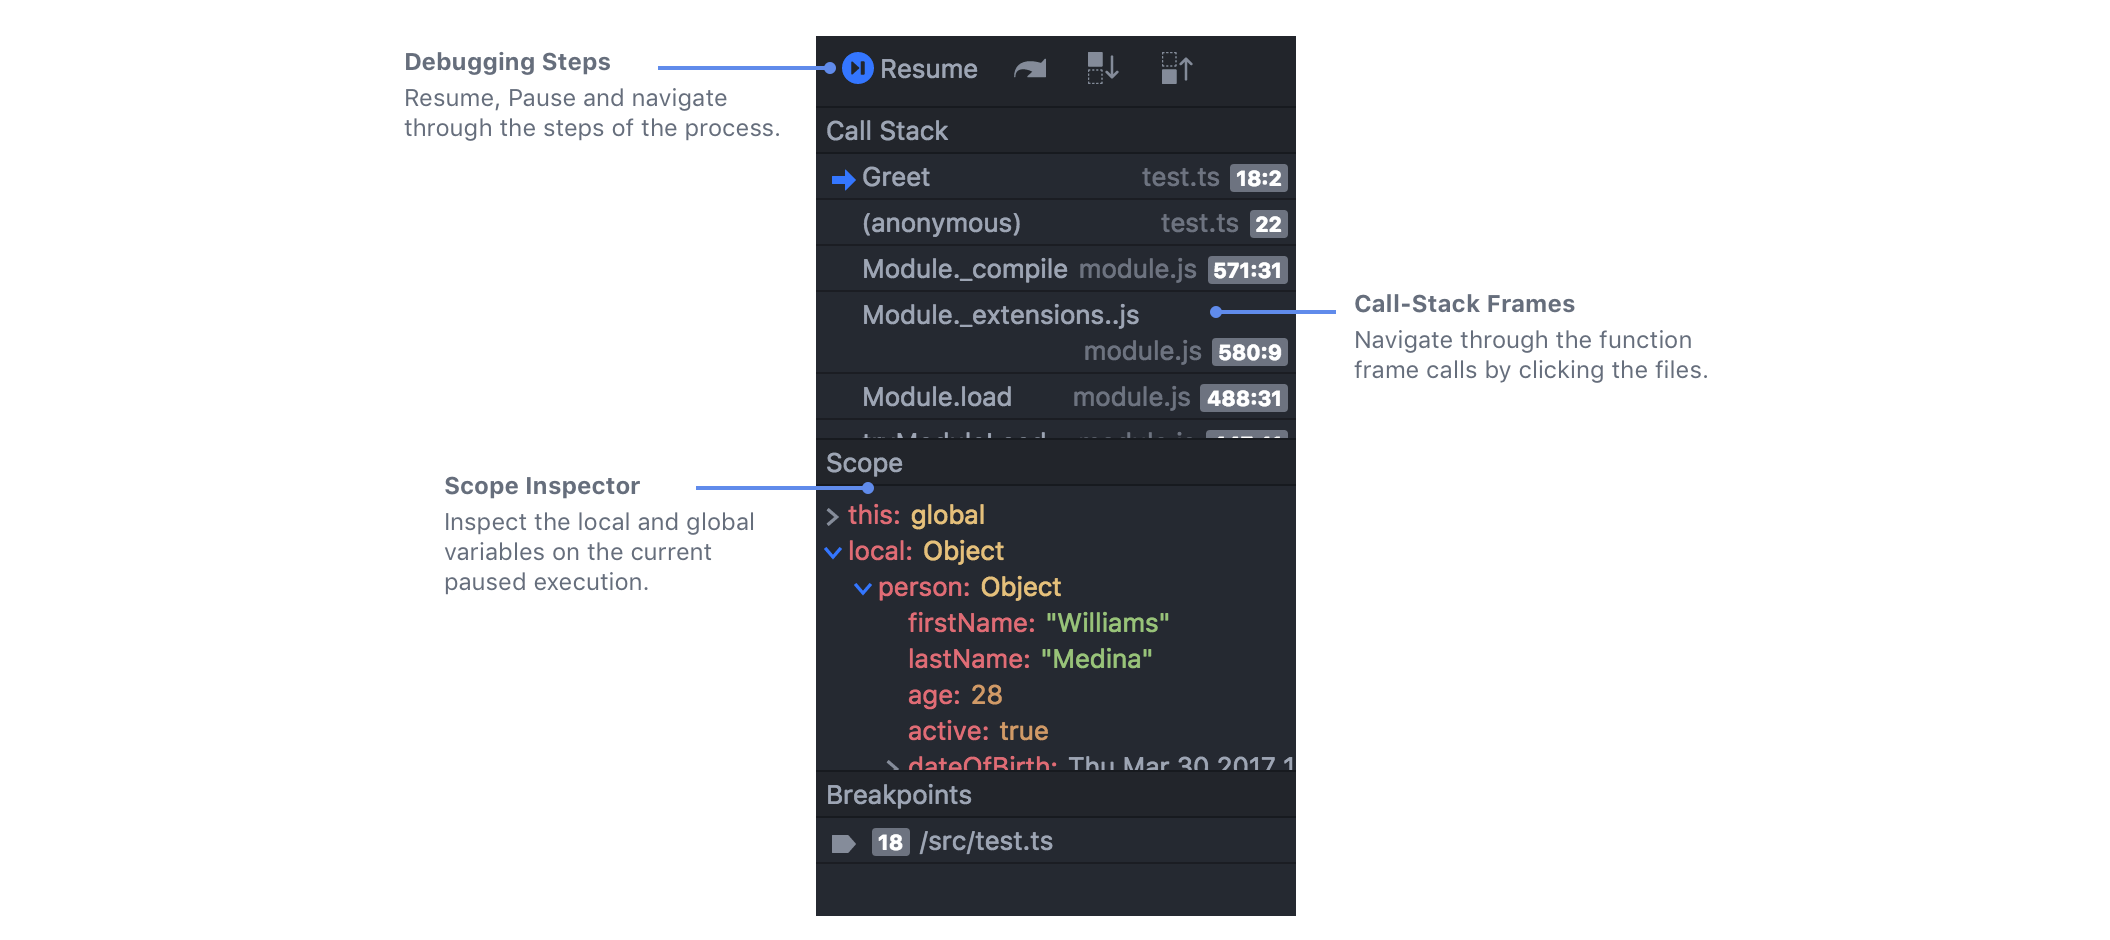
- `Toolbar`: Toolbar API allows to control the execution process, select and configure the selected plugin.

- `Breakpoints`: Add, remove breakpoints by clicking on the file line. breakpoints are accessible from the `Debug Area` as well.

- `Debug Area`: Navigate the current scope status local and global variables, open the current call-stack functions and control the execution step.
- `Configuration`:
### API Documentation
on progress...
### Available Plugins
Below is the list of available plugins so far:
Package|Description
---|---
[NodeJS](https://atom.io/packages/xatom-debug-nodejs)|Run and debug javascript files using NodeJS 6.3+.
[Google Chrome](https://atom.io/packages/xatom-debug-chrome)|Connect the debugger to a server enabling debugging javascript files.
### Requirements
- atom 1.0.0+
### License
MIT