https://github.com/wittline/d3js-dashboard
Building Responsive DashBoard with D3.js and ASP.NET MVC from scratch (SQL SERVER - SSIS - API REST)
https://github.com/wittline/d3js-dashboard
api-rest asp-net-mvc d3-visualization d3js datavisualization javascript mvc-pattern responsive-design sqlserver ssis
Last synced: about 1 year ago
JSON representation
Building Responsive DashBoard with D3.js and ASP.NET MVC from scratch (SQL SERVER - SSIS - API REST)
- Host: GitHub
- URL: https://github.com/wittline/d3js-dashboard
- Owner: Wittline
- Created: 2019-12-10T04:21:06.000Z (over 6 years ago)
- Default Branch: master
- Last Pushed: 2023-05-31T18:57:01.000Z (about 3 years ago)
- Last Synced: 2025-04-13T06:11:23.639Z (over 1 year ago)
- Topics: api-rest, asp-net-mvc, d3-visualization, d3js, datavisualization, javascript, mvc-pattern, responsive-design, sqlserver, ssis
- Language: C#
- Homepage: https://wittline.github.io/D3JS-Dashboard/
- Size: 13.7 MB
- Stars: 13
- Watchers: 2
- Forks: 3
- Open Issues: 7
-
Metadata Files:
- Readme: docs/README.md
Awesome Lists containing this project
README
# Building Responsive DashBoard with D3.js and ASP.NET MVC from scratch (SQL SERVER - SSIS - API REST)
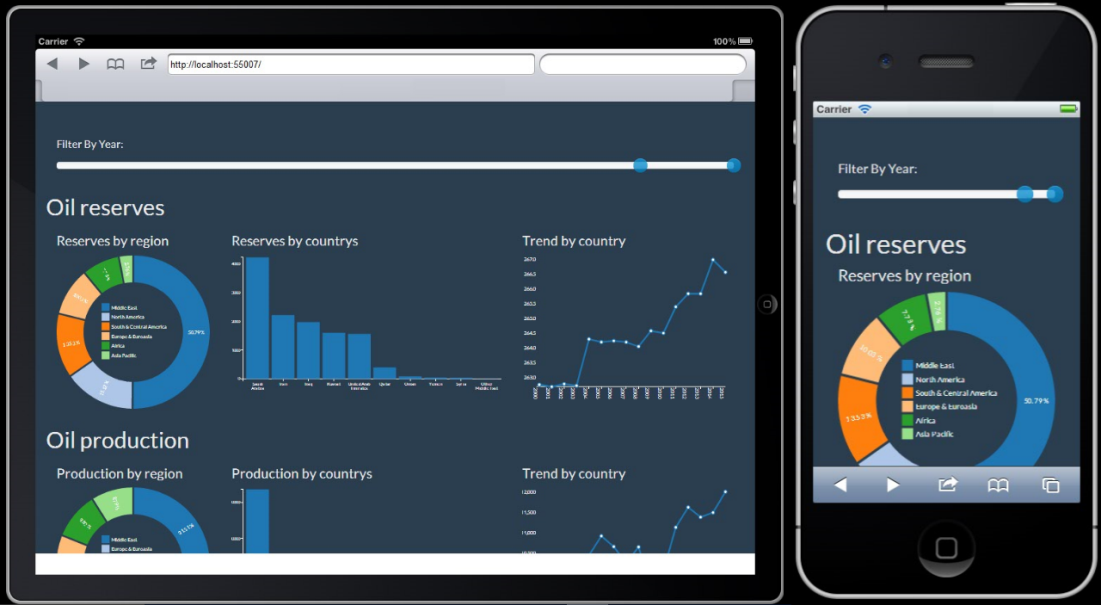
This project explains the creation of an interactive and responsive dashboard for any device, its development was separated into several stages and each of them is explained below:
**Click on the image below to watch the video:**
[](https://www.youtube.com/watch?v=z0aLLAW52oA)
## **Designing a data model**
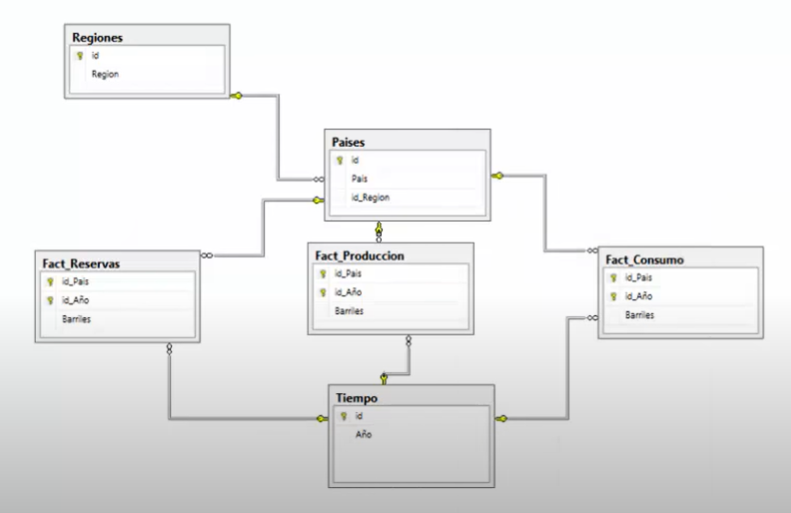
The data model was created using a SQLSERVER database, There are three fact tables Fact_produccion, Fact_reservas and Fact_consumo sharing the same dimension "tiempo" and "paises" this data warehouse schema architecture is also called galaxy or Constellation. The database was not included in this repository, you can create it by following the steps on the youtube video from minute **1:55** to minute **5:00**
## **Designing and creating an ETL process**
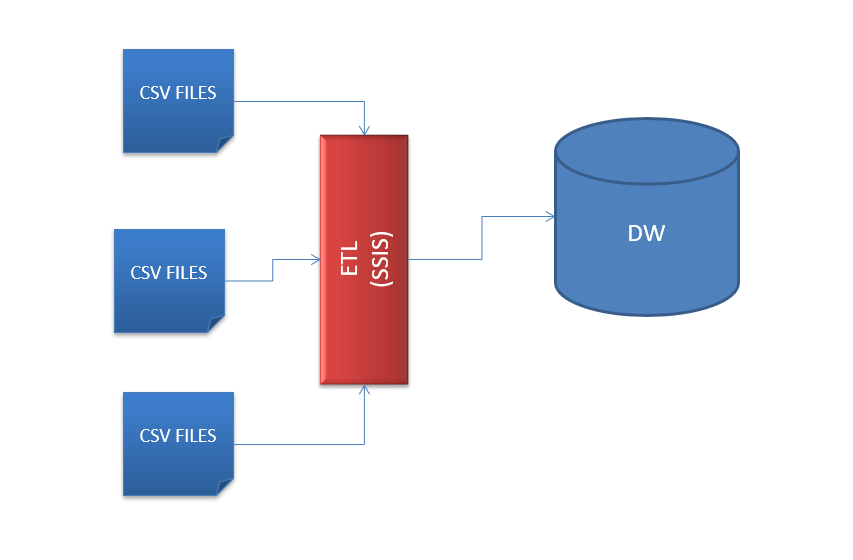
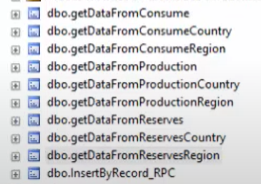
The goal of this stage is to build a ETL process that reads the .csv files and loads them into the database that was designed and created in the previous phase, **the tool choosed to create this ETL process is SSIS and this project was already included in this repository**, the database will need objects that were not included in this repository, such as the stored procedures that the ETL process calls, you can add them to your database by following the steps described in the youtube video from minute: **8:20** to minute **14:00** and from minute **15:50** and **18:54** This database must include the stored procedures called by the API-REST described in the next stage.
## **Creating the API-REST with ASP.NET MVC API**
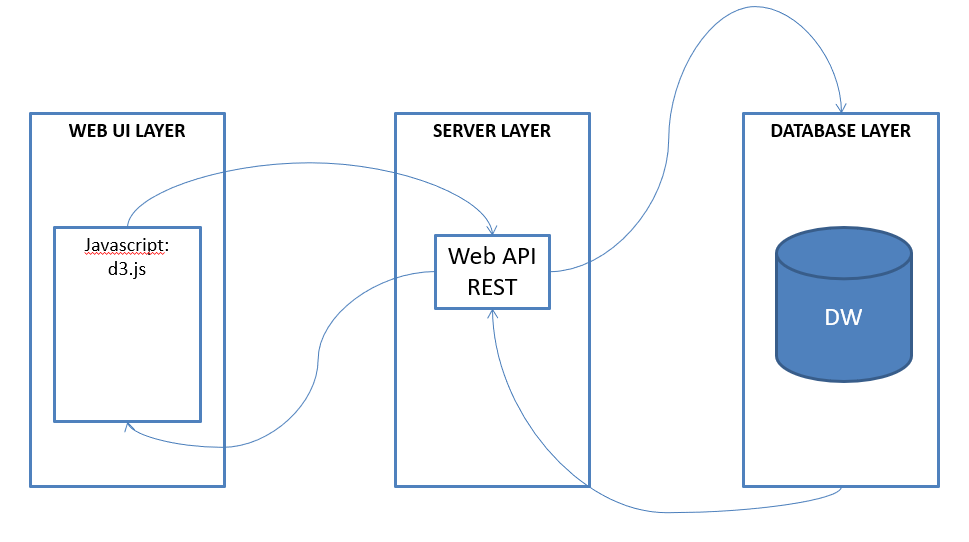
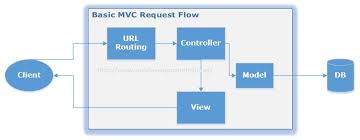
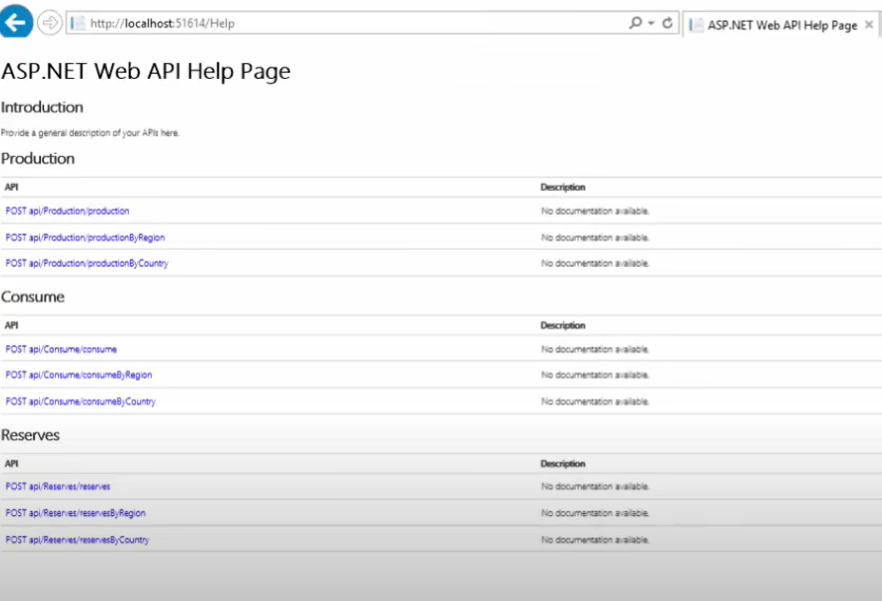
The goal of this stage is to highlight that all the calls coming from the dashboard are through the filters, and each event on these filters makes a request to a REST API. in this way, the back-end code is separated from the front-end. **The API code was added to this repository** and you can see how it was developed in the youtube video from the minute **19:00** to the minute **25:15**
## **Creating the interactive Dashboard with ASP.NET MVC**
**The ASP.NET Web MVC project was added to this repository**, the steps taken in its development can be seen in the youtube video from minute **25:20** to minute **44:15**, this represents the last phase of the project. In the development of this, a group of .js files are created that are responsible for orchestrating all the events cming from the filters and communicating the responses from the requests made to the API-REST, providing the data to the D3.js framework.
```
var yf = 2000,
yt = 2016,
urlReserves = 'http://localhost:8080/api/Reserves/reserves',
urlReservesRegion = 'http://localhost:8080/api/Reserves/reservesByRegion',
urlReservesCountry = 'http://localhost:8080/api/Reserves/reservesByCountry',
urlProduction = 'http://localhost:8080/api/Production/production',
urlProductionRegion = 'http://localhost:8080/api/Production/productionByRegion',
urlProductionCountry = 'http://localhost:8080/api/Production/productionByCountry',
urlConsumption = 'http://localhost:8080/api/Consume/consume',
urlConsumptionRegion = 'http://localhost:8080/api/Consume/consumeByRegion',
urlConsumptionCountry = 'http://localhost:8080/api/Consume/consumeByCountry';
$(document).ready(function () {
$('#sld').slider()
.on('slideStop', function (ev) {
yf = parseInt(ev.value[0]);
yt = parseInt(ev.value[1]);
updateCharts();
});
updateCharts();
});
updateCharts = function ()
{
obj = JSON.stringify({ yearFrom: yf, yearTo: yt, by: '' });
var dsb = new DashboardBuilder();
dsb.buildDashBoard({
charts: [{
type: 'pie', source: urlReserves, params: obj, container: 'pieChart_Reserves',
charts: [{
type: 'bar', source: urlReservesRegion, params: obj, container: 'barChart_Reserves',
charts: [{ type: 'line', source: urlReservesCountry, params: obj, container: 'lineChart_Reserves' }]
}]
},
{
type: 'pie', source: urlProduction, params: obj, container: 'pieChart_Production',
charts: [{
type: 'bar', source: urlProductionRegion, params: obj, container: 'barChart_Production',
charts: [{ type: 'line', source: urlProductionCountry, params: obj, container: 'lineChart_Production' }]
}]
},
{
type: 'pie', source: urlConsumption, params: obj, container: 'pieChart_Consumption',
charts: [{
type: 'bar', source: urlConsumptionRegion, params: obj, container: 'barChart_Consumption',
charts: [{ type: 'line', source: urlConsumptionCountry, params: obj, container: 'lineChart_Consumption' }]
}]
}
]
});
}
```
```
var DashboardBuilder = function ()
{
this.buildDashBoard = function (ctx)
{
var _this = this;
if (!typeof ctx == 'object') return false;
if (ctx.hasOwnProperty('charts'))
{
var chr = ctx['charts'];
for (var p = 0; p < chr.length; p++)
{
switch (chr[p].type) {
case 'pie':
var pc = new pieChart(chr[p].container,
chr[p].source,
chr[p].params,
chr[p].charts);
pc.buildChart();
break;
case 'bar':
break;
case 'line':
break;
}
}
}
}
}
```
# Contributing and Feedback
Any ideas or feedback about this repository?. Help me to improve it.
# Authors
- Created by Ramses Alexander Coraspe Valdez
- Created on 2016
# License
This project is licensed under the terms of the MIT license.