Ecosyste.ms: Awesome
An open API service indexing awesome lists of open source software.
https://github.com/wookayin/expt
Experiment. Plot. Tabulate.
https://github.com/wookayin/expt
Last synced: 2 days ago
JSON representation
Experiment. Plot. Tabulate.
- Host: GitHub
- URL: https://github.com/wookayin/expt
- Owner: wookayin
- License: mit
- Created: 2019-12-28T06:09:06.000Z (about 5 years ago)
- Default Branch: master
- Last Pushed: 2024-08-22T16:30:11.000Z (6 months ago)
- Last Synced: 2024-10-12T13:45:19.623Z (4 months ago)
- Language: Python
- Size: 11.2 MB
- Stars: 68
- Watchers: 4
- Forks: 6
- Open Issues: 13
-
Metadata Files:
- Readme: README.md
- License: LICENSE
Awesome Lists containing this project
README
        # expt

Experiment. Plot. Tabulate.


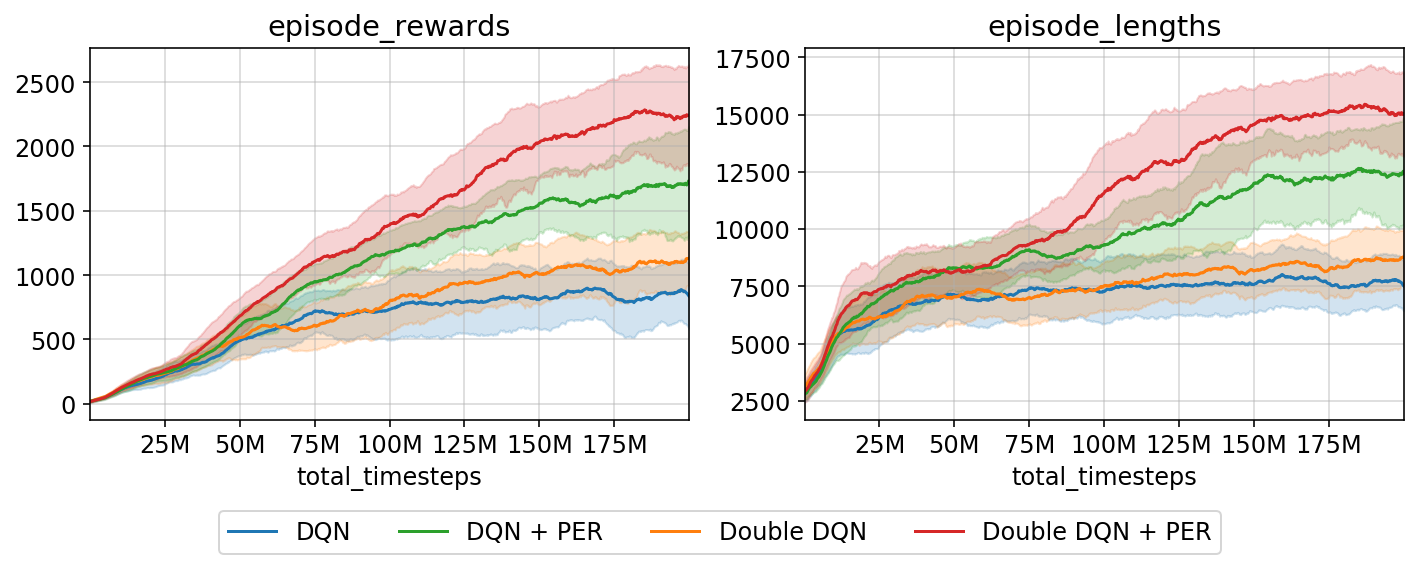
`expt` is a small Python library that helps you draw time-series plots from a tabular data.

Typical use cases are drawing learning curves for machine learning experiments.

`expt` aim to provide a minimal API for doing most of common plotting needs with sensible defaults and useful batteries included.

### Features:

- Parsing of CSV or TensorBoard eventfiles, in parallel

- Easy plotting of individual runs, hypotheses, or experiments.

Usage

-----

See [a demo ipython notebook][demo-notebook], until an user guide and API documentation arrive.

[demo-notebook]: https://github.com/wookayin/expt/blob/master/examples/quick-tour.ipynb

Installation:

```

pip install expt

pip install git+https://github.com/wookayin/expt@master        # Latest development version

```

License

-------

MIT License (c) 2019-2023 Jongwook Choi