https://github.com/y9c/cfutils
🧬 Chromatogram File Utils, a package that integrates trace visualization, mutation calling and quality control for Sanger sequencing data.
https://github.com/y9c/cfutils
bioinformatics biology mutations sanger-chromatograms
Last synced: 8 months ago
JSON representation
🧬 Chromatogram File Utils, a package that integrates trace visualization, mutation calling and quality control for Sanger sequencing data.
- Host: GitHub
- URL: https://github.com/y9c/cfutils
- Owner: y9c
- Created: 2018-05-13T06:26:26.000Z (about 8 years ago)
- Default Branch: master
- Last Pushed: 2024-11-30T08:16:37.000Z (over 1 year ago)
- Last Synced: 2025-04-06T17:18:07.804Z (about 1 year ago)
- Topics: bioinformatics, biology, mutations, sanger-chromatograms
- Language: Python
- Homepage: https://cfutils.yech.science/
- Size: 15.8 MB
- Stars: 22
- Watchers: 1
- Forks: 3
- Open Issues: 0
-
Metadata Files:
- Readme: README.md
- Funding: .github/FUNDING.yml
Awesome Lists containing this project
README
[](https://cfutils.readthedocs.io/en/latest/?badge=latest)
[](https://pypi.python.org/pypi/cfutils)
[](https://pepy.tech/project/cfutils)
**Chromatogram File Utils**
For Sanger sequencing data visualizing, alignment, mutation calling, and trimming etc.
## Demo
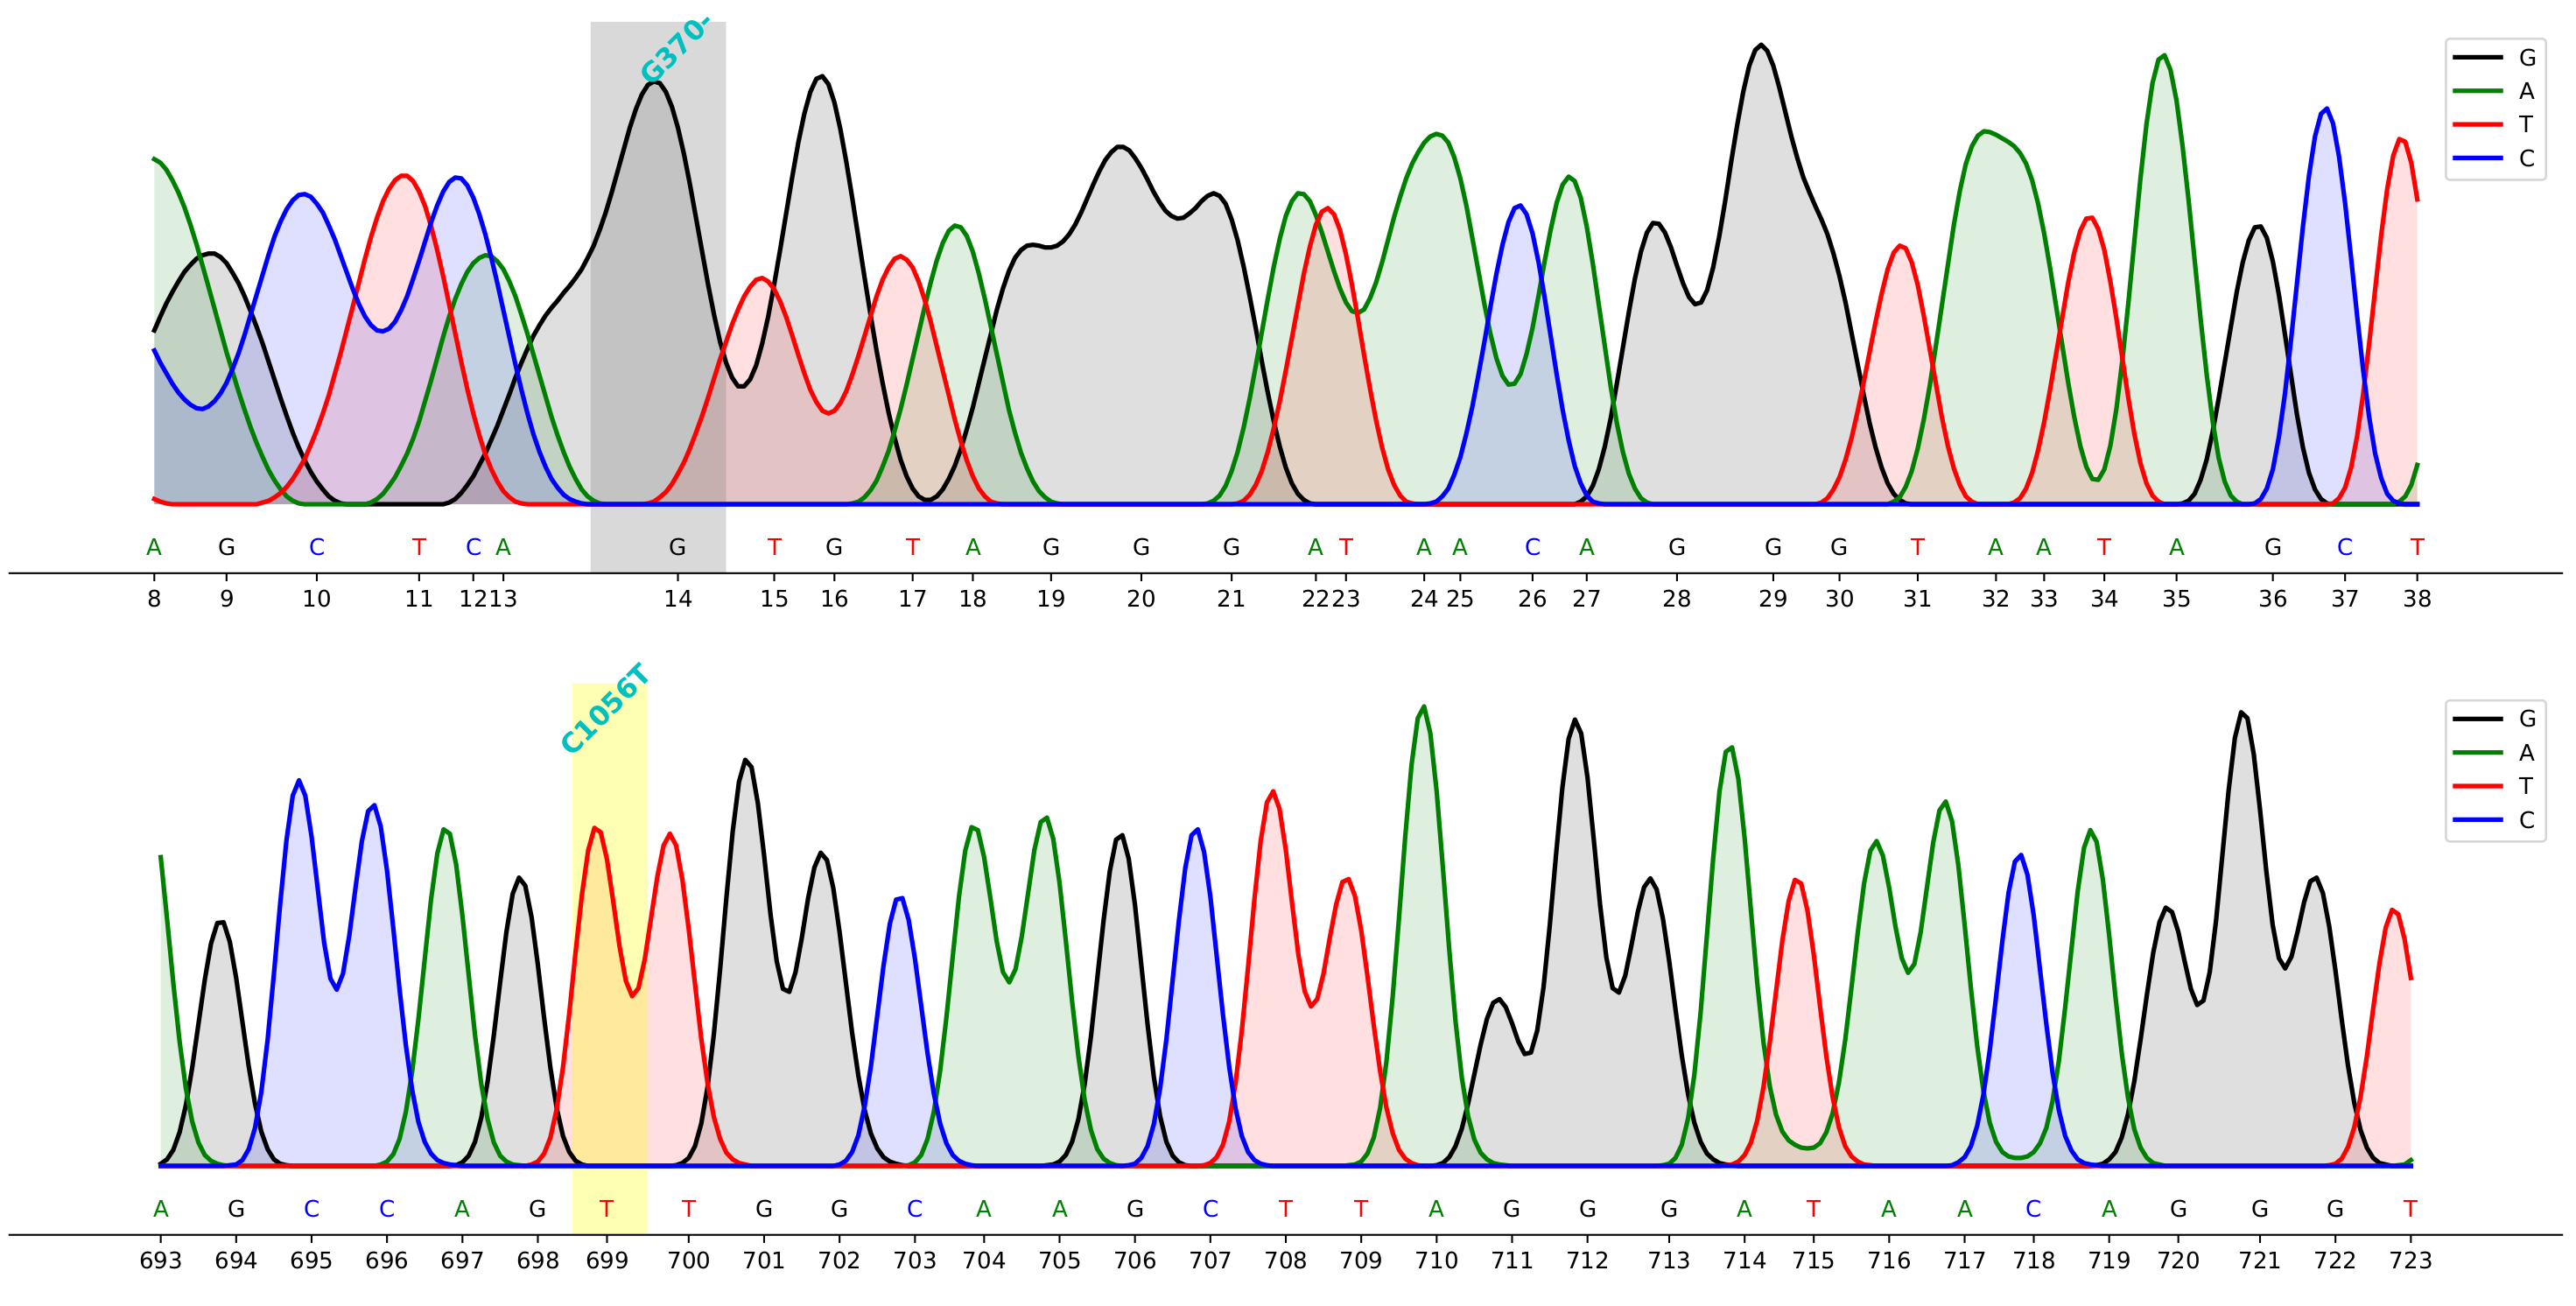
> command to generate the demo above
```bash
cfutils mut --query ./data/B5-M13R_B07.ab1 --subject ./data/ref.fa --outdir ./data/ --plot
```
## How to use?
- You can have mutation detection and visualization in one step using the command line.
```bash
cfutils mut --help
```
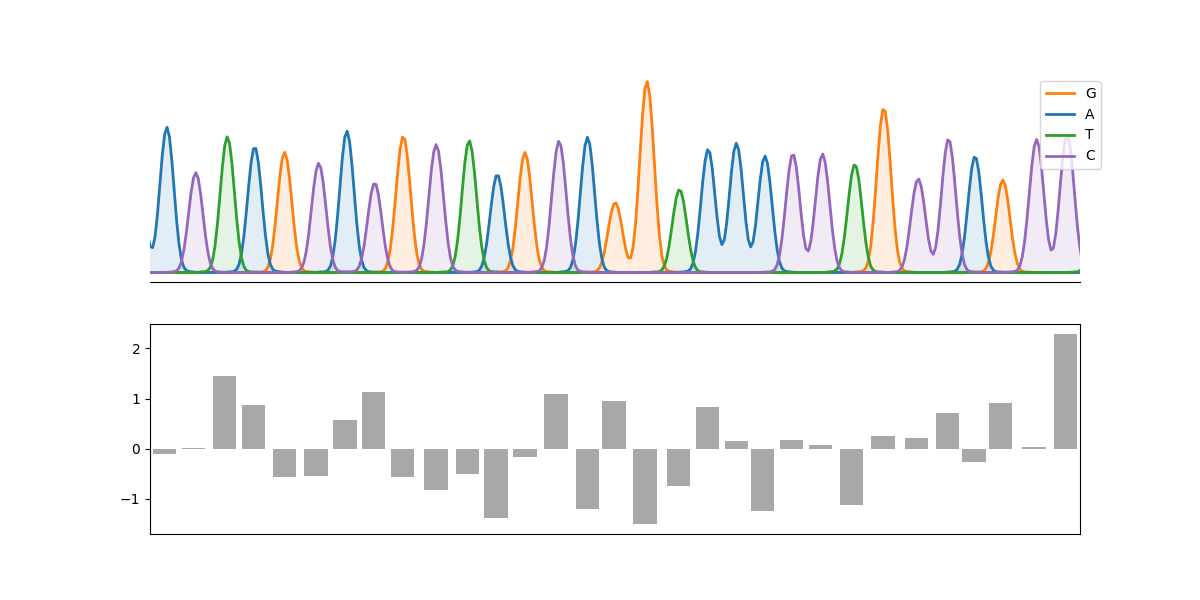
- You can also integrate the result matplotlib figures and use it as a python module.
An example:
```python
import matplotlib.pyplot as plt
import numpy as np
from cfutils.parser import parse_abi
from cfutils.show import plot_chromatograph
seq = parse_abi("./data/B5-M13R_B07.ab1")
peaks = seq.annotations["peak positions"][100:131]
fig, axes = plt.subplots(2, 1, figsize=(12, 6), sharex=True)
plot_chromatograph(
seq,
region=(100, 130),
ax=axes[0],
show_bases=True,
show_positions=True,
color_map=dict(zip("ATGC", ["C0", "C2", "C1", "C4"])),
)
axes[1].bar(peaks, np.random.randn(len(peaks)), color="0.66")
plt.show()
```
## How to install?
### form pypi
_(use this way ONLY, if you don't know what's going on)_
```bash
pip install --user cfutils
```
### manipulate the source code
- clone from github
```bash
git clone git@github.com:y9c/cfutils.git
```
- install the dependence
```bash
make init
```
- do unittest
```bash
make test
```
## ChangeLog
- Reverse completement the chromatogram file. (Inspired by Snapgene)
- build as python package for pypi
- fix bug that highlighting wrong base
- replace blastn with buildin python aligner
## TODO
- [ ] call mutation by alignment and plot Chromatogram graphic
- [ ] add a doc
- [x] change xaxis by peak location
- [ ] fix bug that chromatogram switch pos after trim
- [x] wrap as a cli app
- [ ] return quality score in output
- [ ] fix issue that selected base is not in the middle
- [ ] fix plot_chromatograph rendering bug
- [ ] add projection feature to make align and assemble possible