https://github.com/yaroslaff/glpi-grafana-exporter
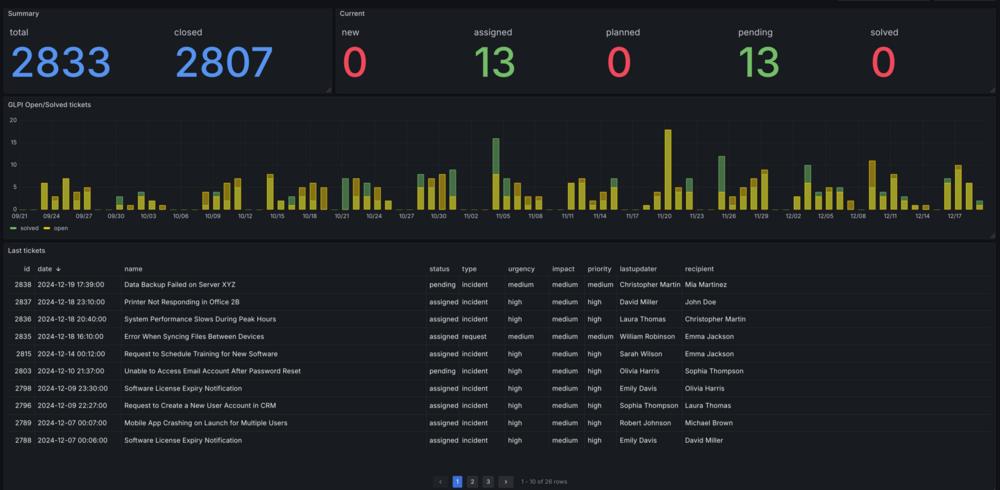
Export statistics about tickets from GLPI database to JSON file for Grafana Infinity Datasource
https://github.com/yaroslaff/glpi-grafana-exporter
cloud dashboard export glpi grafana grafana-infinity-datasource grafanacloud graph json mysql postgresql support ticket tickets
Last synced: 2 months ago
JSON representation
Export statistics about tickets from GLPI database to JSON file for Grafana Infinity Datasource
- Host: GitHub
- URL: https://github.com/yaroslaff/glpi-grafana-exporter
- Owner: yaroslaff
- License: mit
- Created: 2024-12-17T14:27:00.000Z (4 months ago)
- Default Branch: master
- Last Pushed: 2025-01-07T14:08:52.000Z (4 months ago)
- Last Synced: 2025-02-08T08:34:15.213Z (3 months ago)
- Topics: cloud, dashboard, export, glpi, grafana, grafana-infinity-datasource, grafanacloud, graph, json, mysql, postgresql, support, ticket, tickets
- Language: Python
- Homepage:
- Size: 391 KB
- Stars: 0
- Watchers: 1
- Forks: 0
- Open Issues: 0
-
Metadata Files:
- Readme: README.md
- License: LICENSE
Awesome Lists containing this project
README
# GLPI to Grafana exporter
This script exports GLPI statistics from database into JSON format, usable with [grafana-infinity-datasource](https://github.com/grafana/grafana-infinity-datasource) plugin of [Grafana](https://grafana.com/). Tested on GLPI version 10.0.6.
## Install
~~~
pipx install glpi-grafana-exporter[mysql]
~~~
(or postgresql)
On debian you may need to install:
~~~
apt install -y build-essential pkg-config libmariadb-dev python3-dev
~~~
Example config (`config.env`):
~~~
DBURL=mysql:///support
TICKETS_TABLE=glpi_tickets
USERS_TABLE=glpi_users
JSONFILE=/var/www/html/statistics/glpi.json
OPEN=25
~~~
DBURL is in SQLAlchemy format: `dialect+driver://username:password@host:port/database`, e.g.:
~~~
postgresql+psycopg2://user:password@localhost:5432/mydatabase
mysql://user:password@localhost:3306/mydatabase
~~~
(you can omit `+driver` part)
## Make JSON file
~~~
# make glpi.json with statistics for last year
glpi-grafana-exporter -c config.env --hard 365
# recalculate statistics for a last 3 days (for [daily] cron job)
glpi-grafana-exporter -c config.env --hard 3
~~~
at this step you get glpi.json file for Grafana with Infinity Datasource plugin. Update it from cron job.
## Make grafana dashboard
1. Install [Grafana Infinity Datasource
](https://grafana.com/grafana/plugins/yesoreyeram-infinity-datasource/) plugin
2. Configure it (Connection > Data Sources > yesoreyeram-infinity-datasource > Security), to allow "https://raw.githubusercontent.com/" (for demo JSON) or your URL. Save & test.
3. use [demo/dashboard.json](https://raw.githubusercontent.com/yaroslaff/glpi-grafana-exporter/refs/heads/master/demo/dashboard.json) to create dashboard in Grafana (or Grafana Cloud).
4. Set `DatasourceID` variable (at top of dashboard) to your infinity datasource ID (See URL at Connections > Data sources > yesoreyeram-infinity-datasource).
5. At this step you should see demo data from github repository. You can change URL to your `glpi.json` location. Do not forget to allow it in datasource "Security" tab as on step 2.