Ecosyste.ms: Awesome
An open API service indexing awesome lists of open source software.
https://github.com/yu9824/ternary_diagram
This package makes it easier for you to draw beautiful ternary diagram without pymatgen.
https://github.com/yu9824/ternary_diagram
chemistry materials-informatics matplotlib python ternary-diagrams visualization
Last synced: 4 months ago
JSON representation
This package makes it easier for you to draw beautiful ternary diagram without pymatgen.
- Host: GitHub
- URL: https://github.com/yu9824/ternary_diagram
- Owner: yu9824
- License: mit
- Created: 2020-09-06T07:04:21.000Z (over 4 years ago)
- Default Branch: main
- Last Pushed: 2023-09-16T13:02:55.000Z (over 1 year ago)
- Last Synced: 2024-08-08T20:39:57.770Z (7 months ago)
- Topics: chemistry, materials-informatics, matplotlib, python, ternary-diagrams, visualization
- Language: Python
- Homepage: https://yu9824.github.io/ternary_diagram/
- Size: 17.4 MB
- Stars: 15
- Watchers: 1
- Forks: 2
- Open Issues: 1
-
Metadata Files:
- Readme: README.md
- License: LICENSE
Awesome Lists containing this project
README
# Ternary Diagram
[](https://pypi.org/project/ternary-diagram/)
[](https://pypi.org/project/ternary-diagram/)
[](https://pypi.org/project/ternary-diagram/)
[](https://pepy.tech/project/ternary-diagram)
[](https://github.com/yu9824/ternary_diagram/actions/workflows/pytest-on-each-version.yaml)
[](https://github.com/psf/black)
[](https://anaconda.org/conda-forge/ternary-diagram/)
[](https://anaconda.org/conda-forge/ternary-diagram)
This package makes it easier for you to draw beautiful ternary diagram **without** [pymatgen](https://pymatgen.org).
Meaningly, only need `numpy` and `matplotlib`.
## What you will be able to do with this package
- Create beautiful contour maps easily
- Creating a scatter plot
- Draw tie lines
- Automatically format chemical composition using subscripts
- Most of the matplotlib options are available

## How to install
### PyPI
```bash
pip install ternary-diagram
```
PyPI project is [here](https://pypi.org/project/ternary-diagram/).
### Anaconda
```bash
conda install -c conda-forge ternary-diagram
```
Anaconda (conda-forge) package site is [here](https://anaconda.org/conda-forge/ternary-diagram).
## Usage
See [Examples](#examples) and the [documentation](https://yu9824.github.io/ternary_diagram/).
### Examples
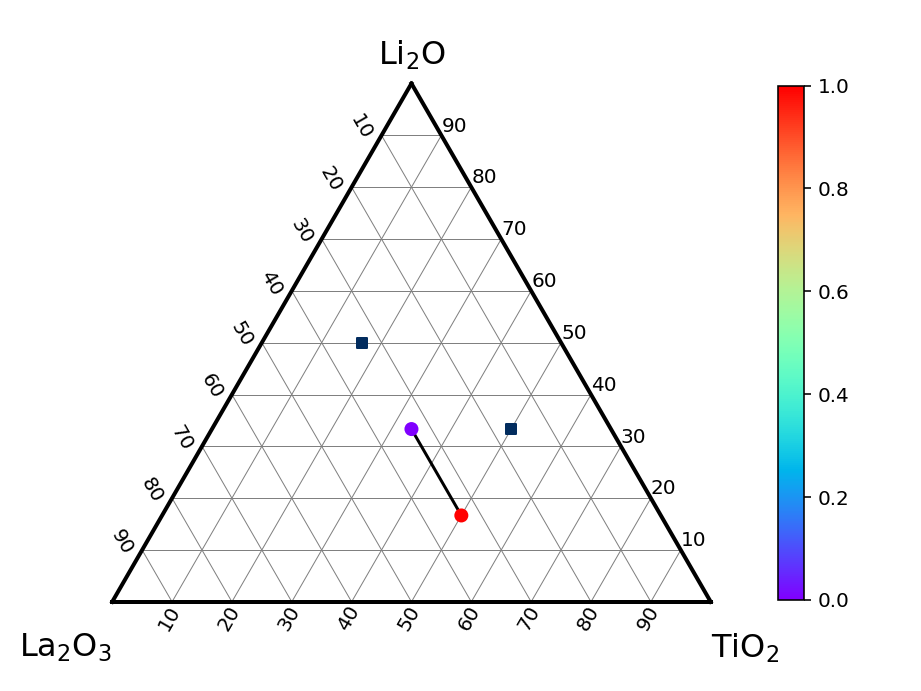
An easy example is here.
```python
import matplotlib.pyplot as plt
from ternary_diagram import TernaryDiagram
# You can set `ax` to select which axes to draw. If not, the current axes will be used.
td = TernaryDiagram(["Li2O", "La2O3", "TiO2"])
# scatter
td.scatter(vector=[[1, 1, 1], [1, 2, 3]], z=[0, 1])
# You can set some options in `plt.scatter` like `marker`, `c` etc.
td.scatter(vector=[[2, 1, 3], [3, 2, 1]], marker="s", c="#022c5e", s=30)
# line plot
# You can set some options in `plt.plot` like `lw`, `c`, and so on.
td.plot([[1, 1, 1], [1, 2, 3]], color="black")
# save figure
td.fig.savefig("figure.png", dpi=144)
```
It can be written like this.
```python
# The background color is sometimes transparent in jupyter notebooks, so set facecolor 'white'.
fig, ax = plt.subplots(facecolor="w")
# You can set `ax` to select which axes to draw. If not, the current axes will be used.
td = TernaryDiagram(["Li2O", "La2O3", "TiO2"], ax=ax)
# scatter
td.scatter(vector=[[1, 1, 1], [1, 2, 3]], z=[0, 1])
# You can set some options in `plt.scatter` like `marker`, `c` etc.
td.scatter(vector=[[2, 1, 3], [3, 2, 1]], marker="s", c="#022c5e", s=30)
# line plot
# You can set some options in `plt.plot` like `lw`, `c`, and so on.
td.plot([[1, 1, 1], [1, 2, 3]], color="black")
# save figure
fig.savefig("figure.png", dpi=144)
```
It means that you can draw multiple figures in one figure object.
See also the [example](https://github.com/yu9824/ternary_diagram/tree/main/example) folder.
## Histories
### v3.1.0
- Delete `.utils._BasePlotter.get_x_y` (we should access directly).
- Resolve #10 (Create `fill` argument in `TernaryDiagram.contour`).
- Resolve #11 (Create `auto_latex_notation` argument in `TernaryDiagram`).
- Update documentation.
- Update docstrings and typings.
## LICENSE
See [LICENSE](https://github.com/yu9824/ternary_diagram/tree/main/LICENSE).
MIT Licence
Copyright (c) 2021 yu9824