https://github.com/z3tt/beyond-bar-and-box-plots
Slides, recording and hands-on tutorial for the USGS Data Science webinar
https://github.com/z3tt/beyond-bar-and-box-plots
Last synced: 9 months ago
JSON representation
Slides, recording and hands-on tutorial for the USGS Data Science webinar
- Host: GitHub
- URL: https://github.com/z3tt/beyond-bar-and-box-plots
- Owner: z3tt
- Created: 2021-09-16T10:13:16.000Z (about 4 years ago)
- Default Branch: main
- Last Pushed: 2023-09-26T15:20:29.000Z (about 2 years ago)
- Last Synced: 2025-02-02T00:49:03.449Z (10 months ago)
- Language: HTML
- Homepage:
- Size: 22.2 MB
- Stars: 234
- Watchers: 3
- Forks: 39
- Open Issues: 0
-
Metadata Files:
- Readme: README.md
Awesome Lists containing this project
- awesome-ggplot2 - Beyond Bar and Box Plots: Chart Alternatives and How to Design Them with ggplot2
README
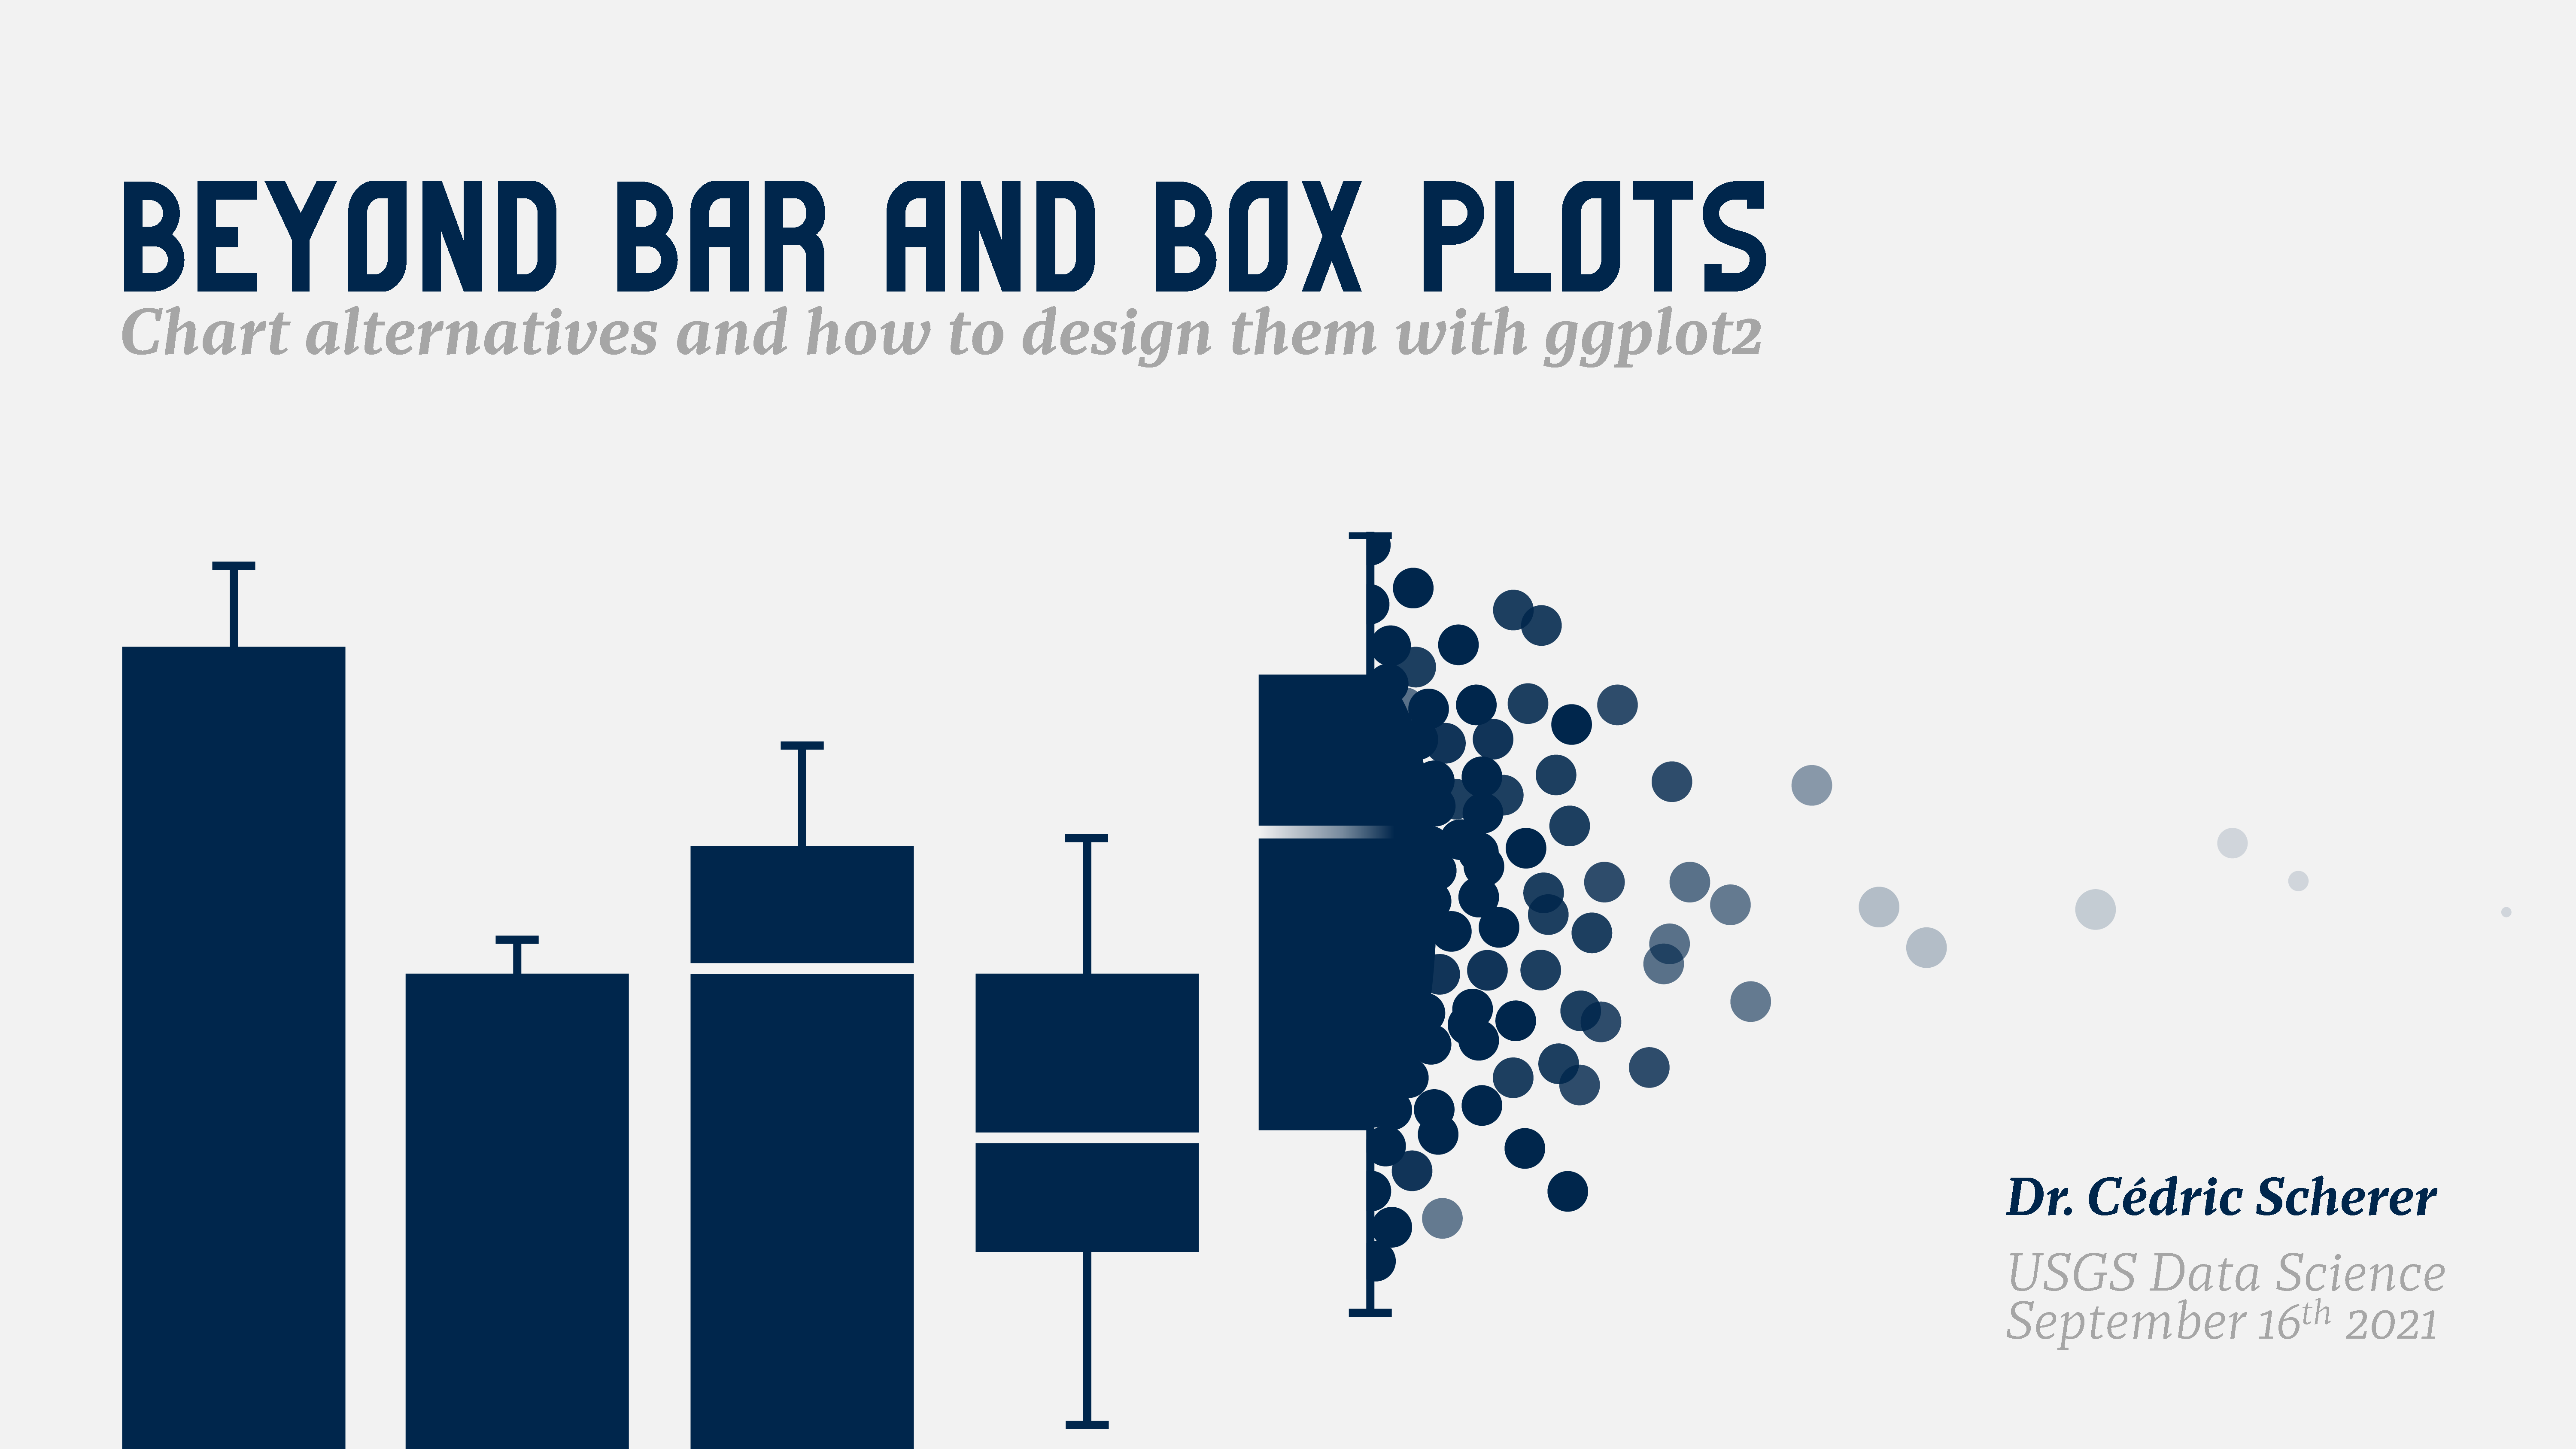
Beyond Bar and Box Plots


Slides and hands-on codes for my talk at the [USGS Community for Data Integration](https://twitter.com/USGS_CDI) and [USGS Data Science Team](https://www.usgs.gov/mission-areas/water-resources/science/data-science-water-resources?qt-science_center_objects=0#qt-science_center_objects) on September, 16 2021.
### Talk Resources:
* [Slides](https://www.cedricscherer.com/slides/USGS-2021-beyond-bar-and-box-plots.pdf)
* [Hands-On Tutorial](https://z3tt.github.io/beyond-bar-and-box-plots)
* [Codes](https://github.com/z3tt/beyond-bar-and-box-plots/blob/main/BeyondBarAndBoxPlots.Rmd)
* [Recording](https://www.youtube.com/watch?v=WBA04fjTVU0)
***
Attribution-NonCommercial-ShareAlike 4.0 International (CC BY-NC-SA 4.0)
