Ecosyste.ms: Awesome
An open API service indexing awesome lists of open source software.
https://github.com/zifeihan/eprofiler-idea
java performance tool in idea
https://github.com/zifeihan/eprofiler-idea
hotmethod jvmti profiler
Last synced: 12 days ago
JSON representation
java performance tool in idea
- Host: GitHub
- URL: https://github.com/zifeihan/eprofiler-idea
- Owner: zifeihan
- Created: 2019-11-20T07:21:34.000Z (about 5 years ago)
- Default Branch: master
- Last Pushed: 2021-04-01T08:34:00.000Z (over 3 years ago)
- Last Synced: 2024-11-01T08:50:37.120Z (19 days ago)
- Topics: hotmethod, jvmti, profiler
- Language: Java
- Size: 6.26 MB
- Stars: 16
- Watchers: 2
- Forks: 5
- Open Issues: 0
-
Metadata Files:
- Readme: README.md
Awesome Lists containing this project
README
##### 使用方法:在idea插件中安装(导入) eprofiler.jar
##### 支持版本:目前仅支持MAC,linux操作系统,后期打算覆盖windows
##### 安装方式:在IDEA插件中选择本地安装即可
##### 运行原理:项目在启动过程中在jvm参数上加载了指定的agent
##### 实现原理:内部agent采用c++实现,和IDEA的火焰图性能分析插件类似
##### 需求反馈:如果有感兴趣的伙伴可以联系我,一起将其完善。
##### 功能增强:
###### 1.打算在性能分析堆栈树加入代码跳转,点击相关的热点方法即可进入项目中的代码(已完成,11.23)
###### 2.目前是实时分析的,后期会加入项目运行结束查看项目启动过程中的所有分析结果的聚合态
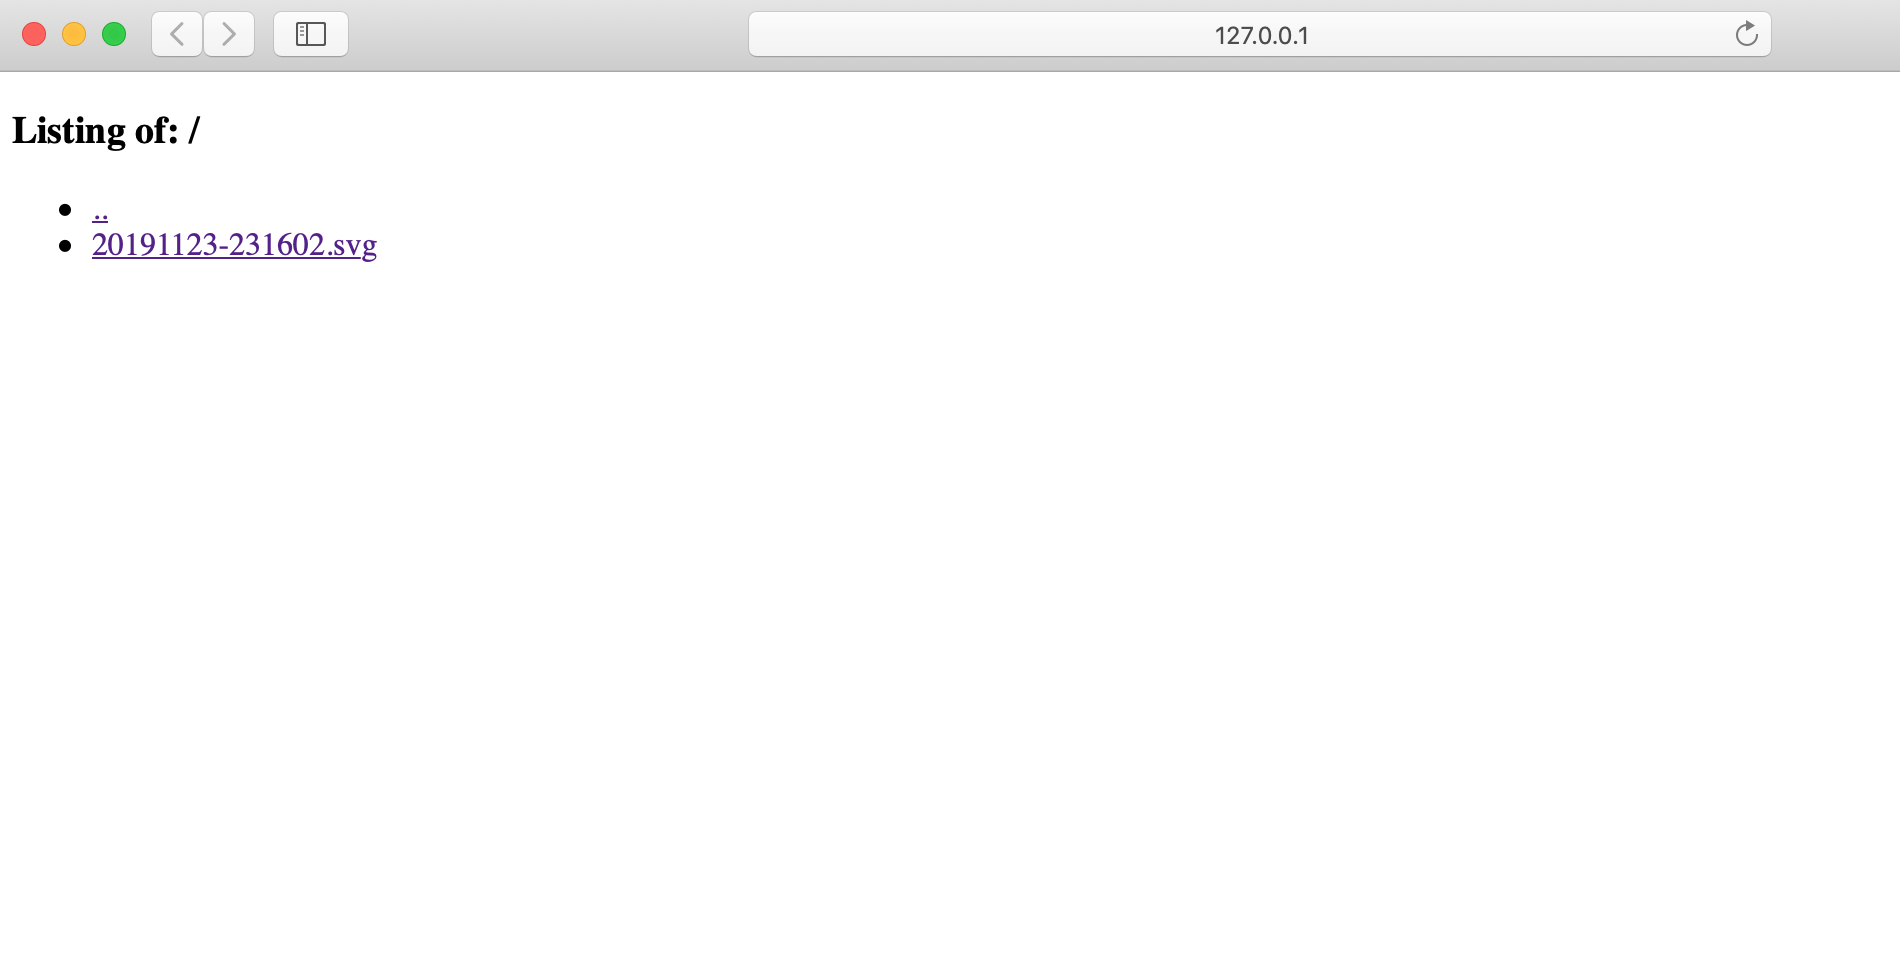
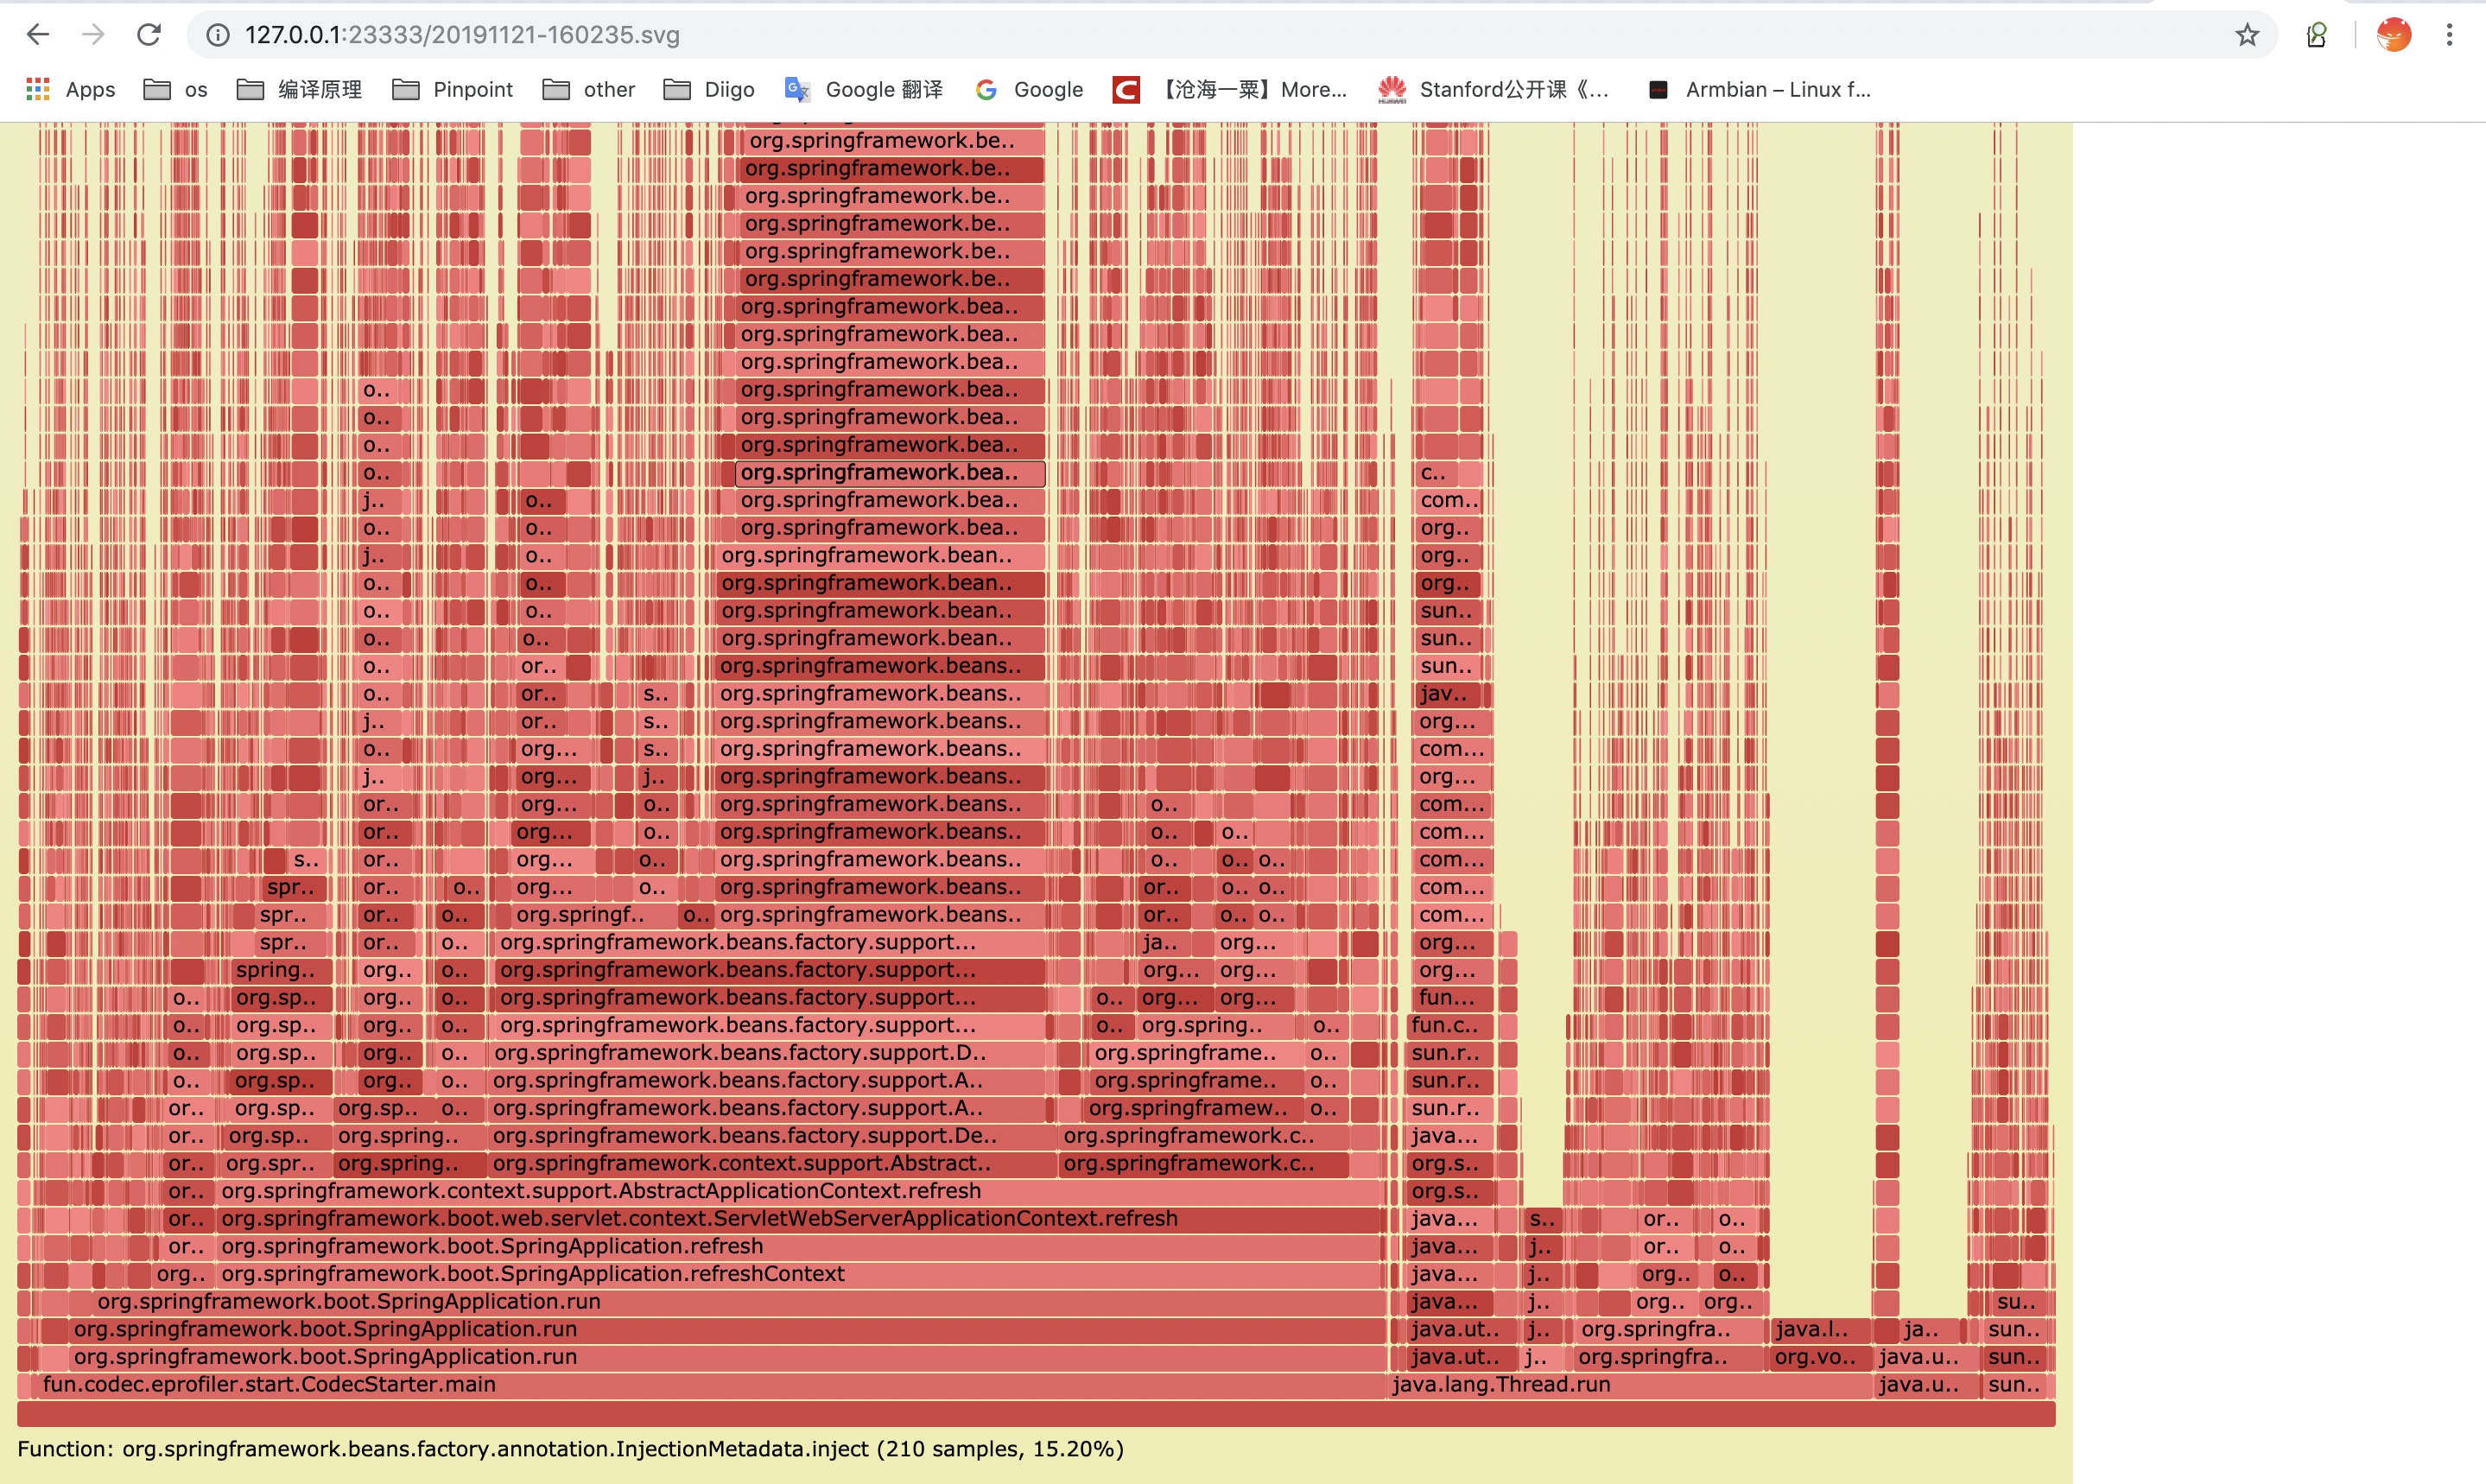
###### 3.支持导出分析结果为火焰图(已完成,11.19) 在使用idea插件过程中,点击性能分析数据窗口的导出火焰图(在运行过程中可多次导出火焰图),打开链接: http://127.0.0.1:23333 即可跳转火焰图数据列表
###### 1.介绍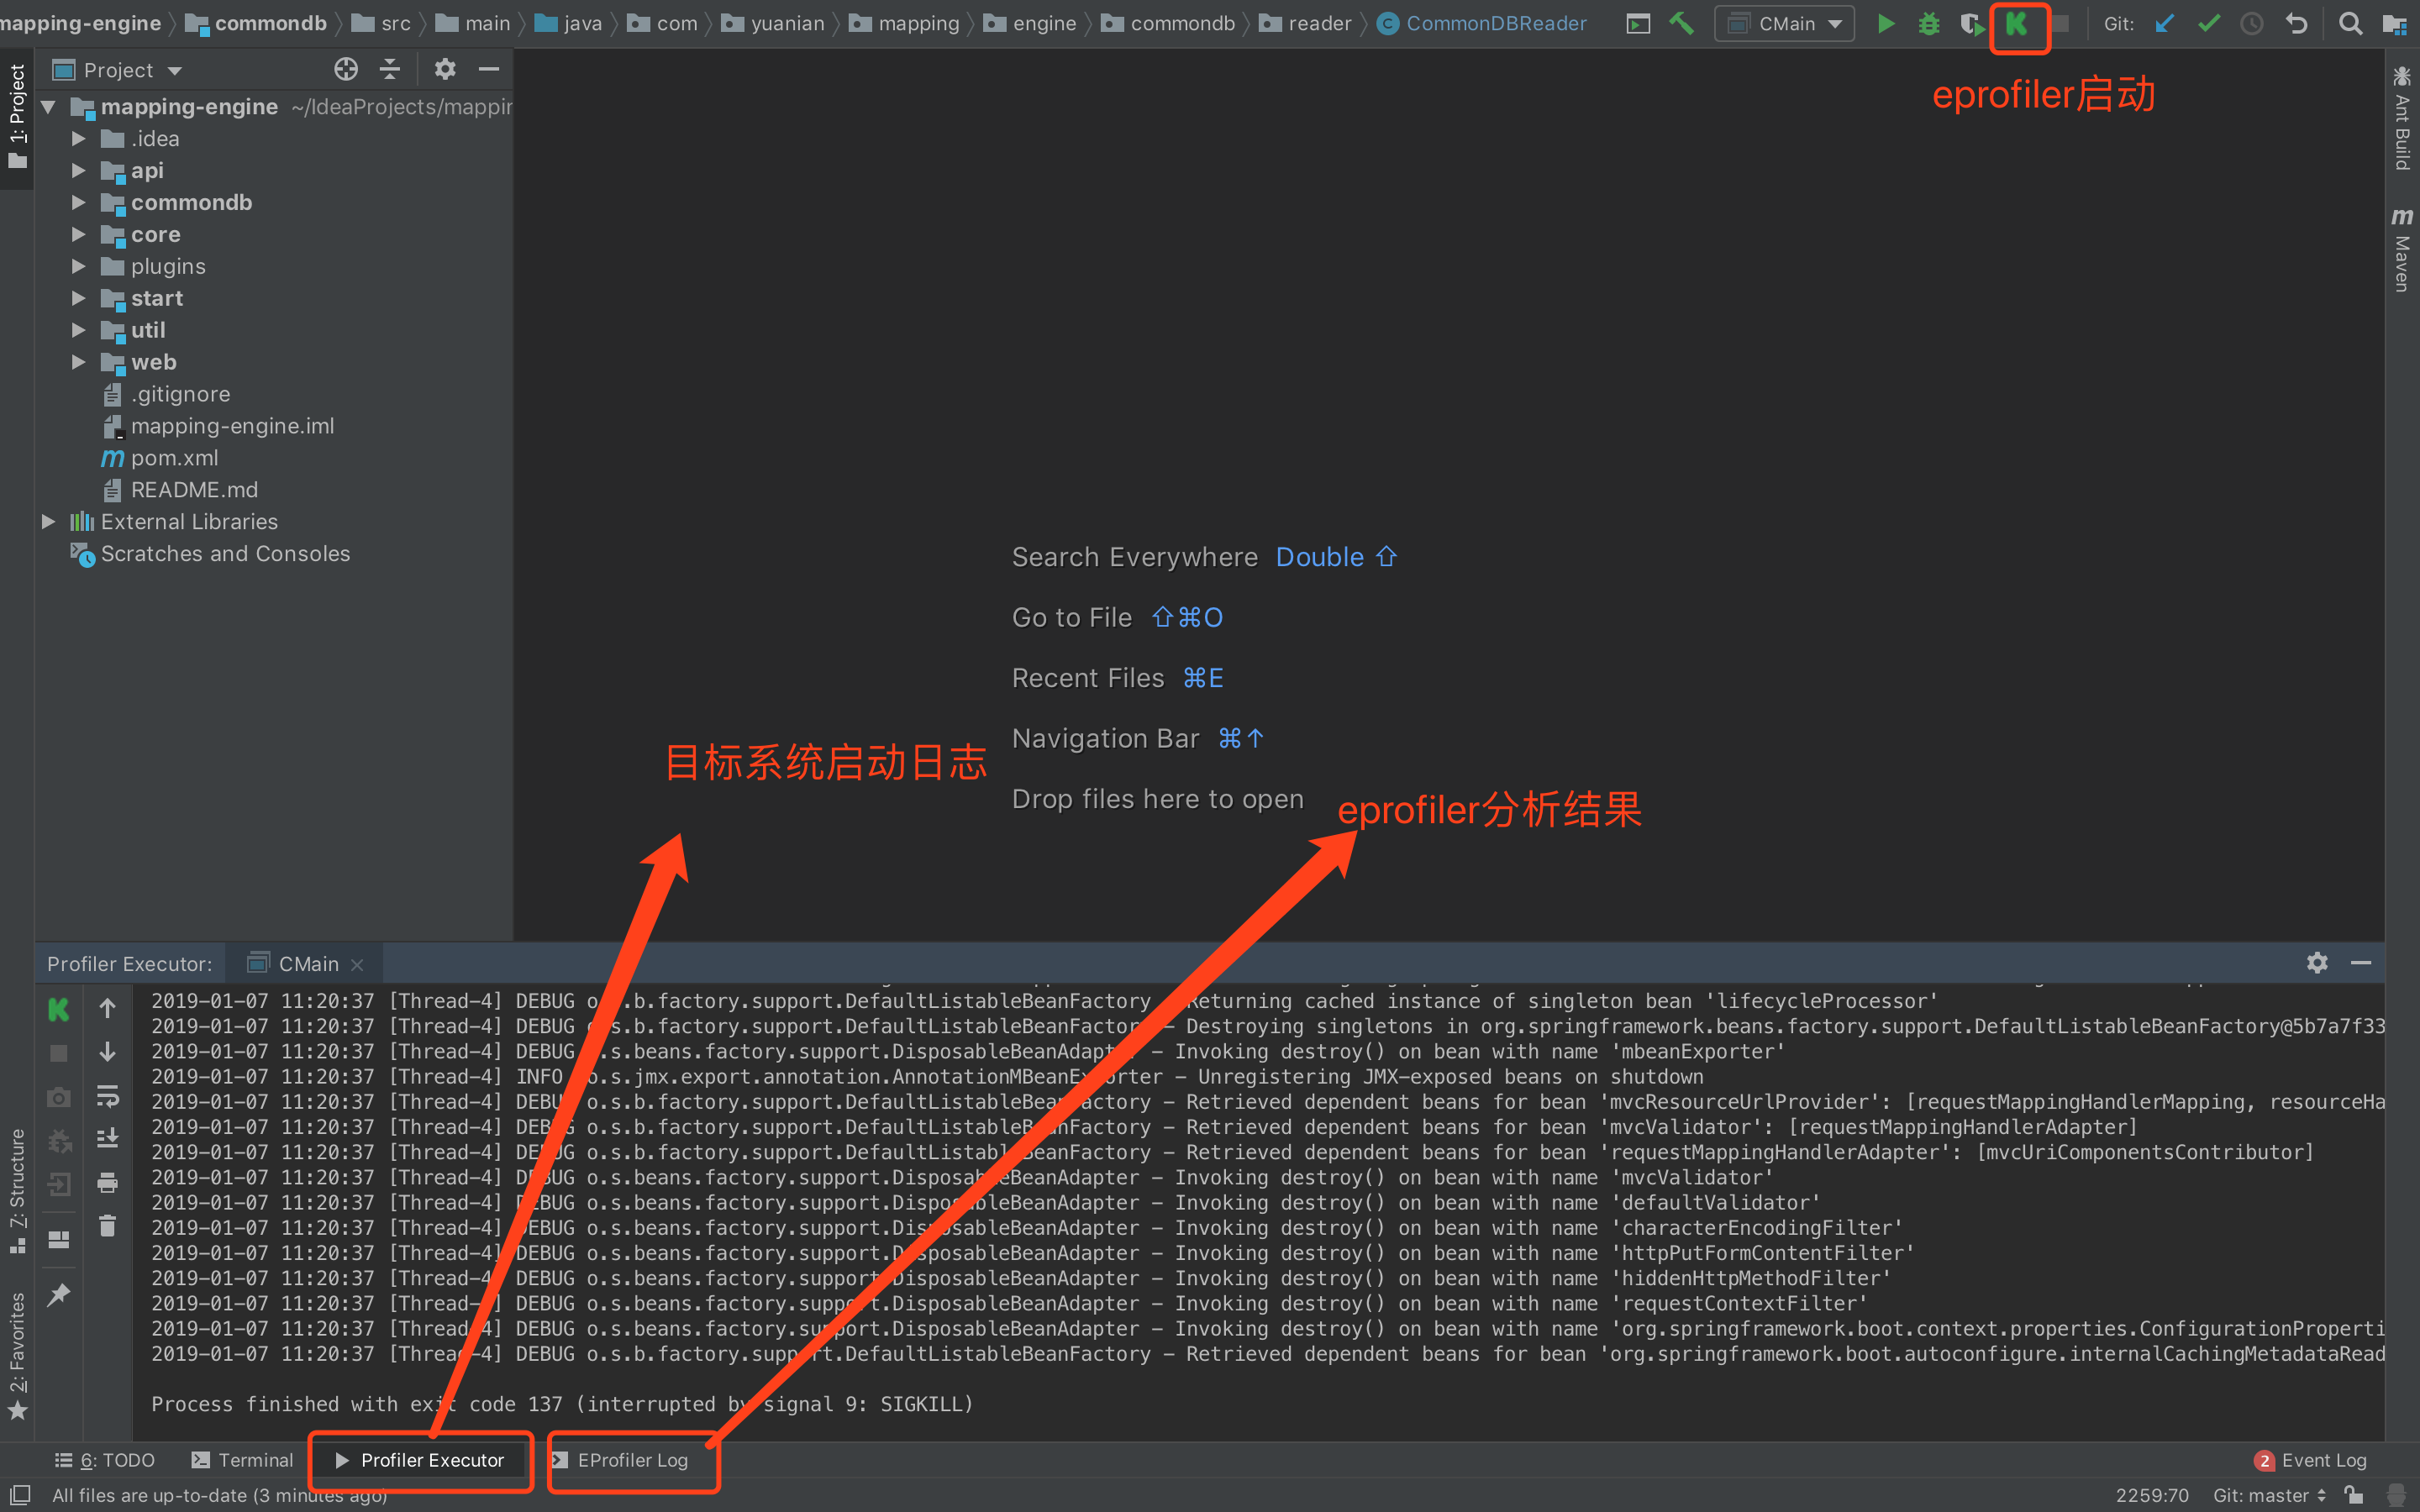
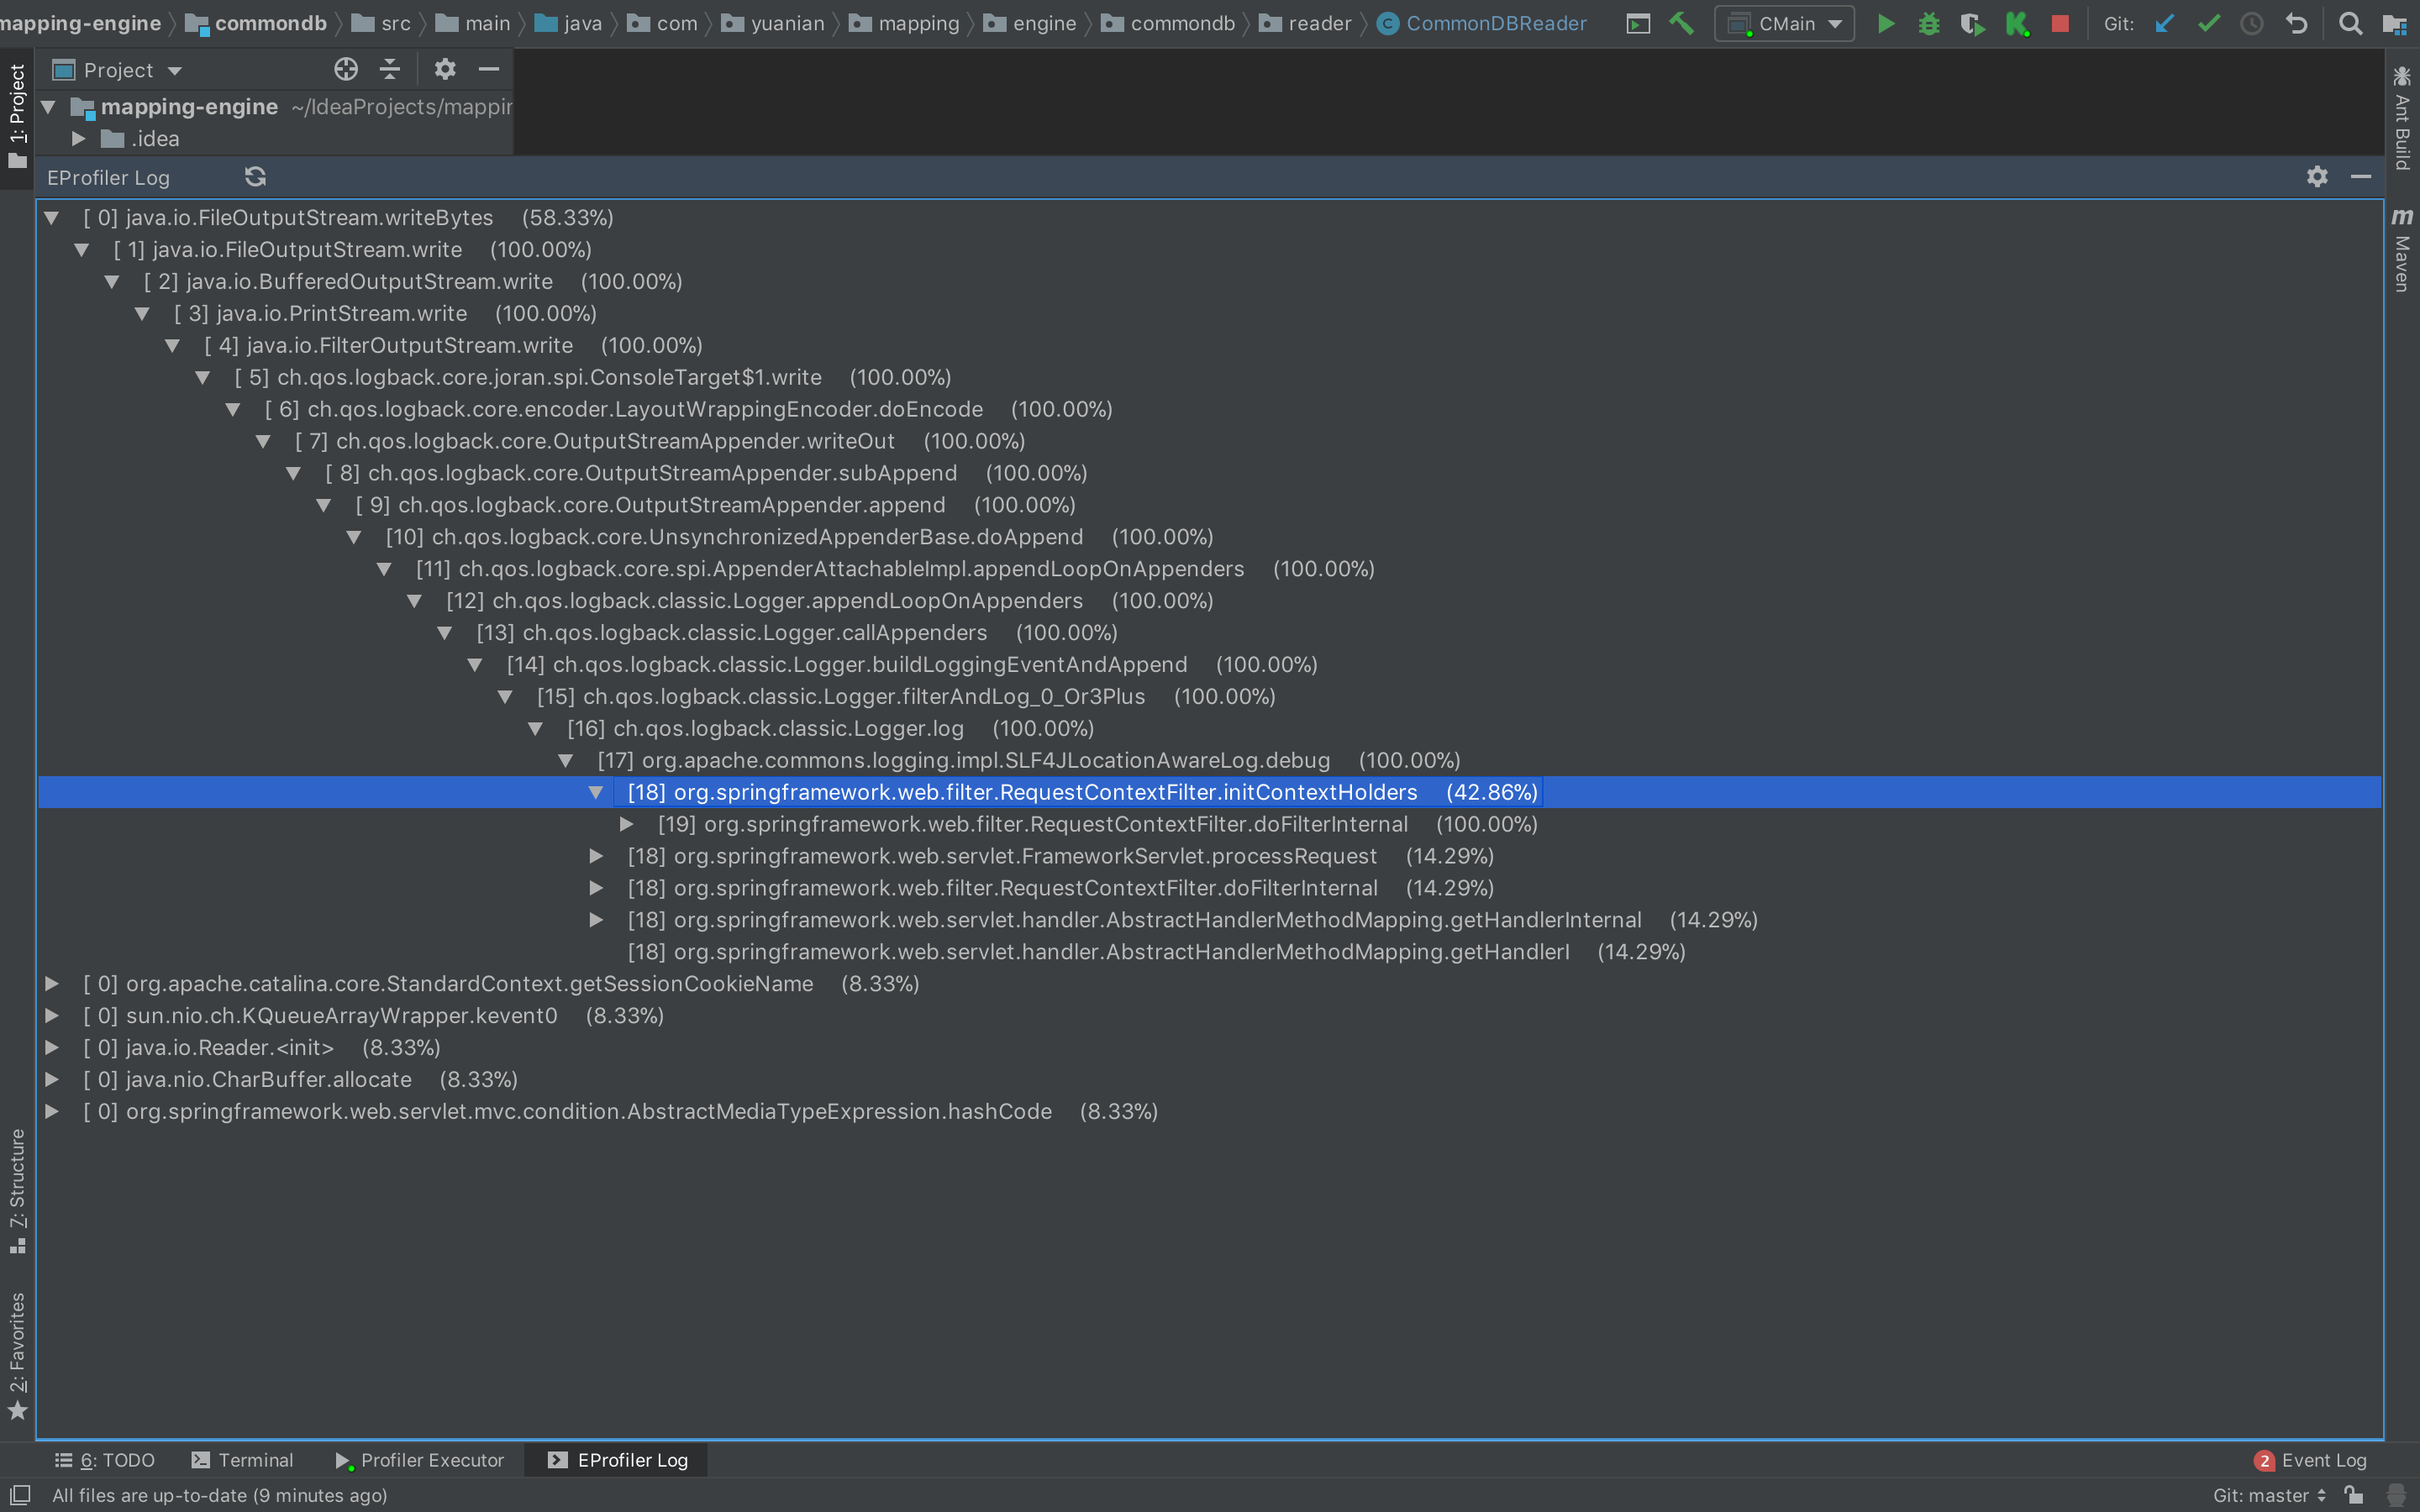
###### 2.性能分析日志
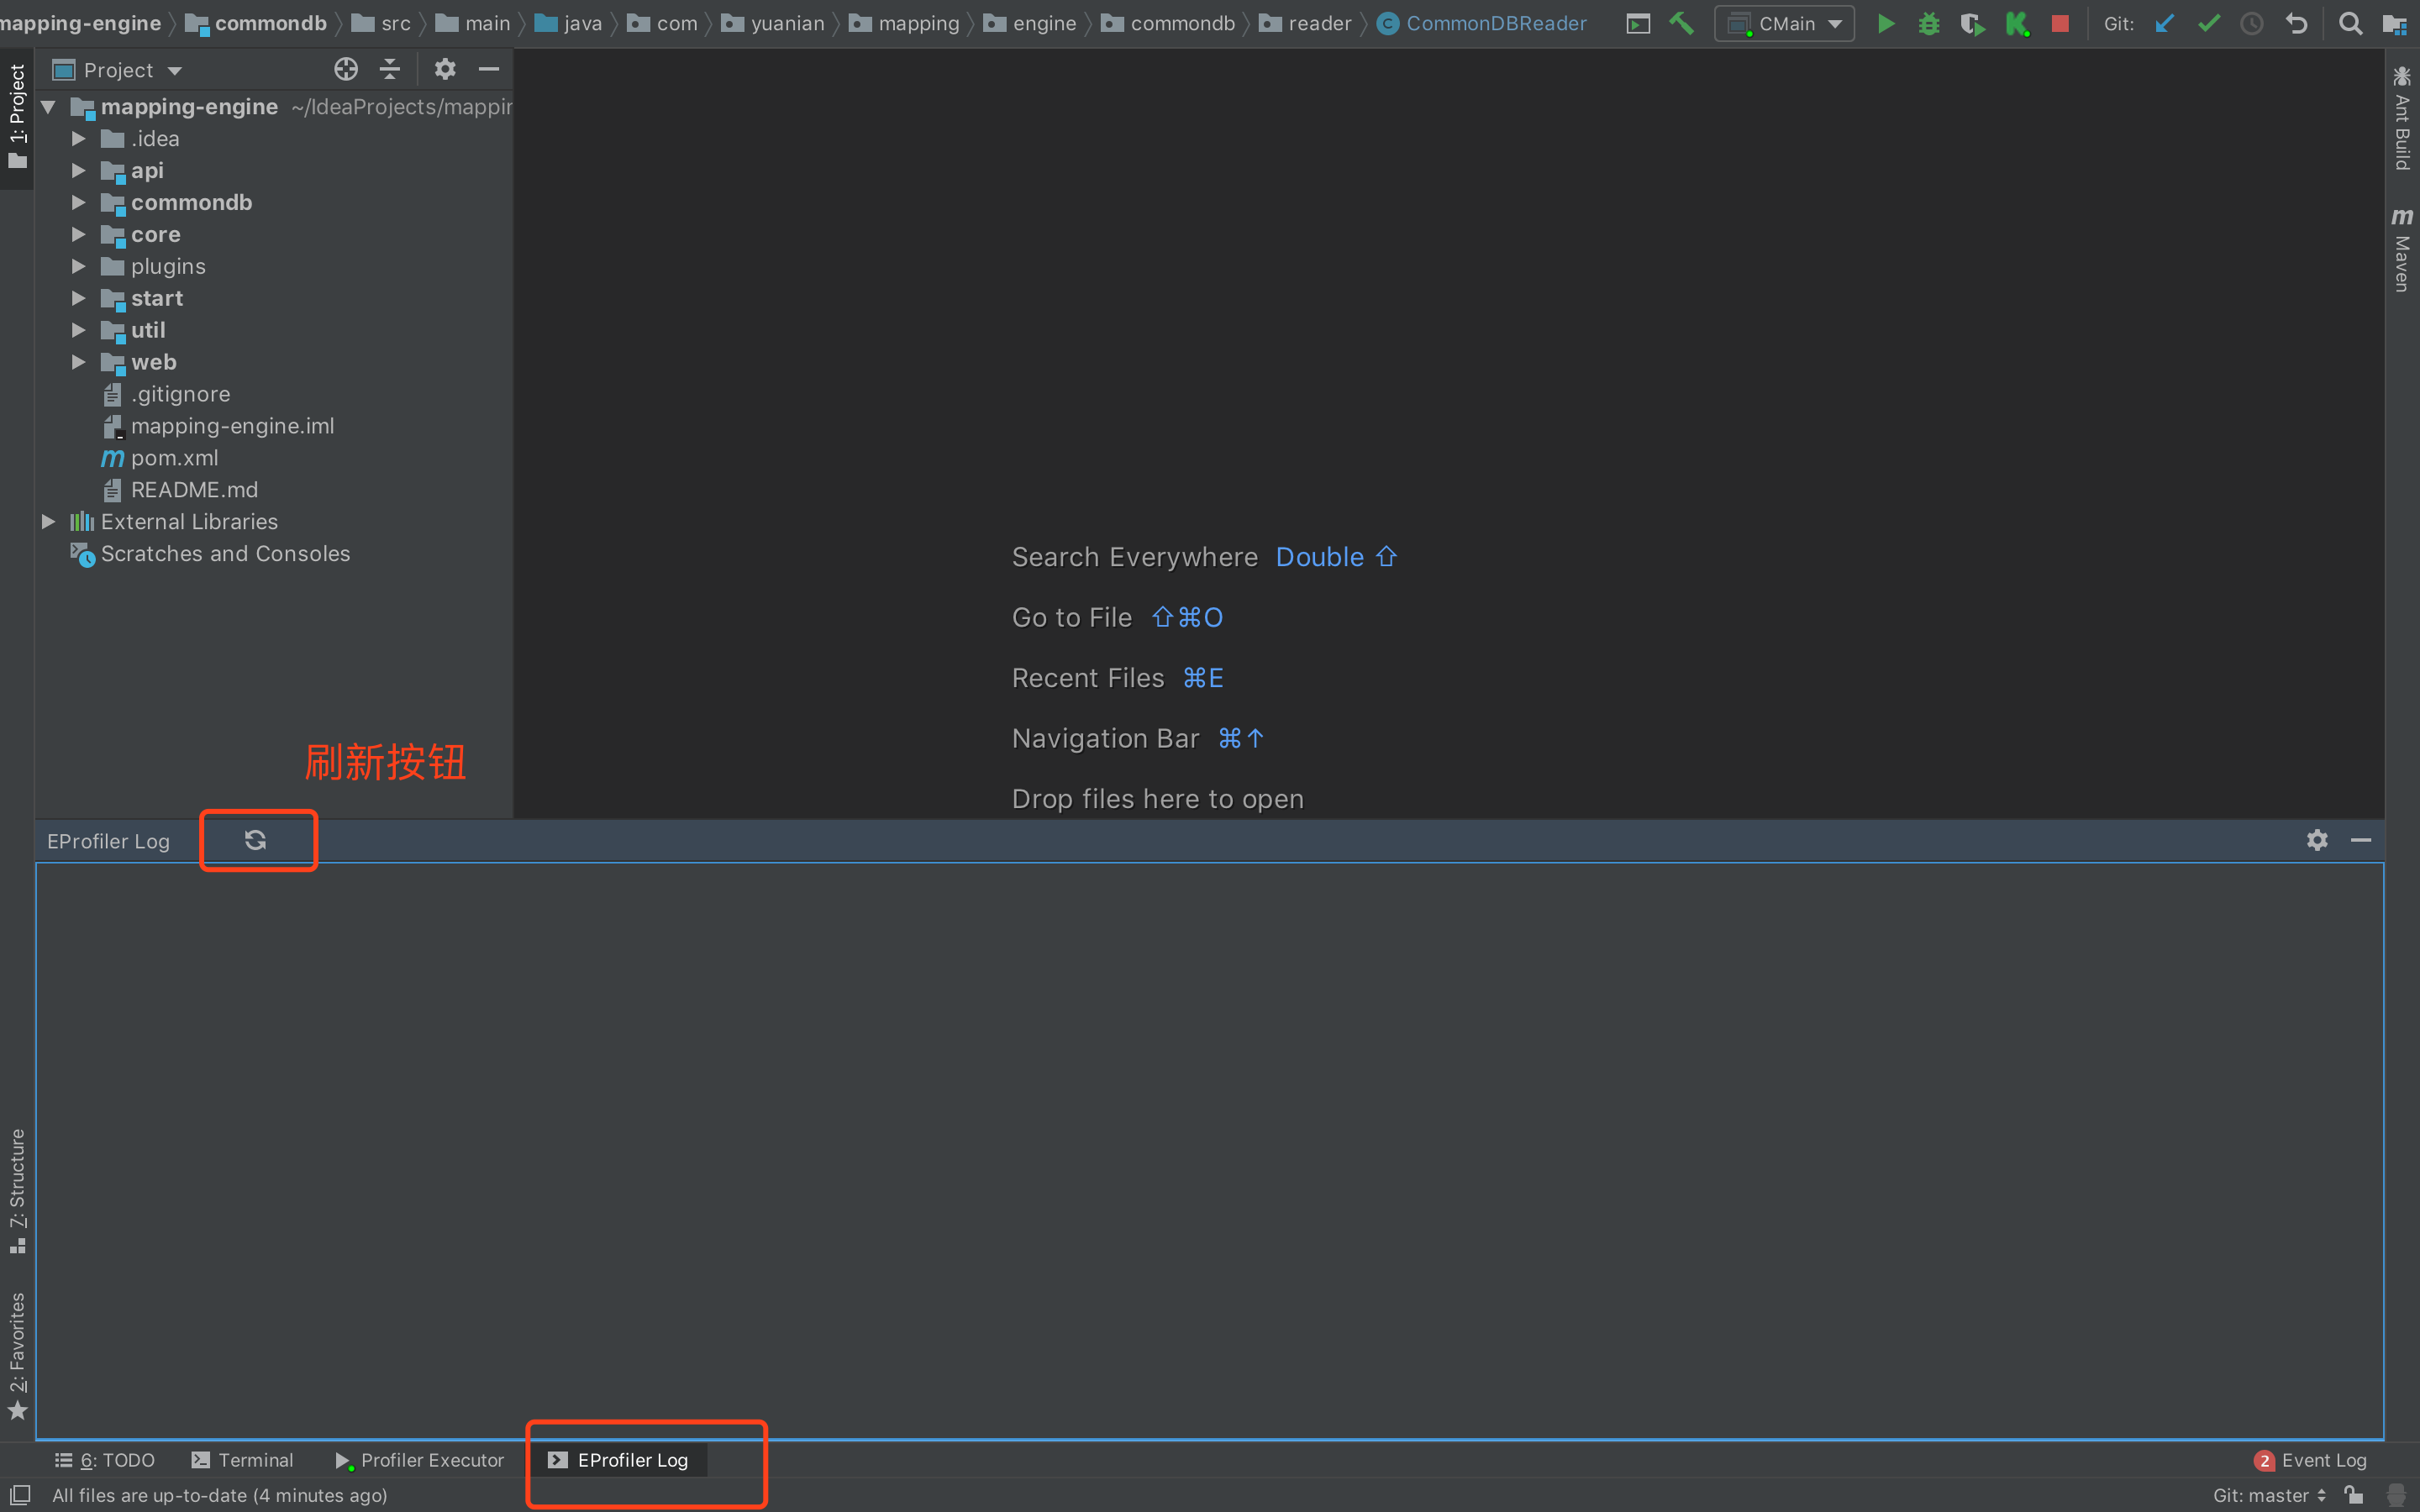
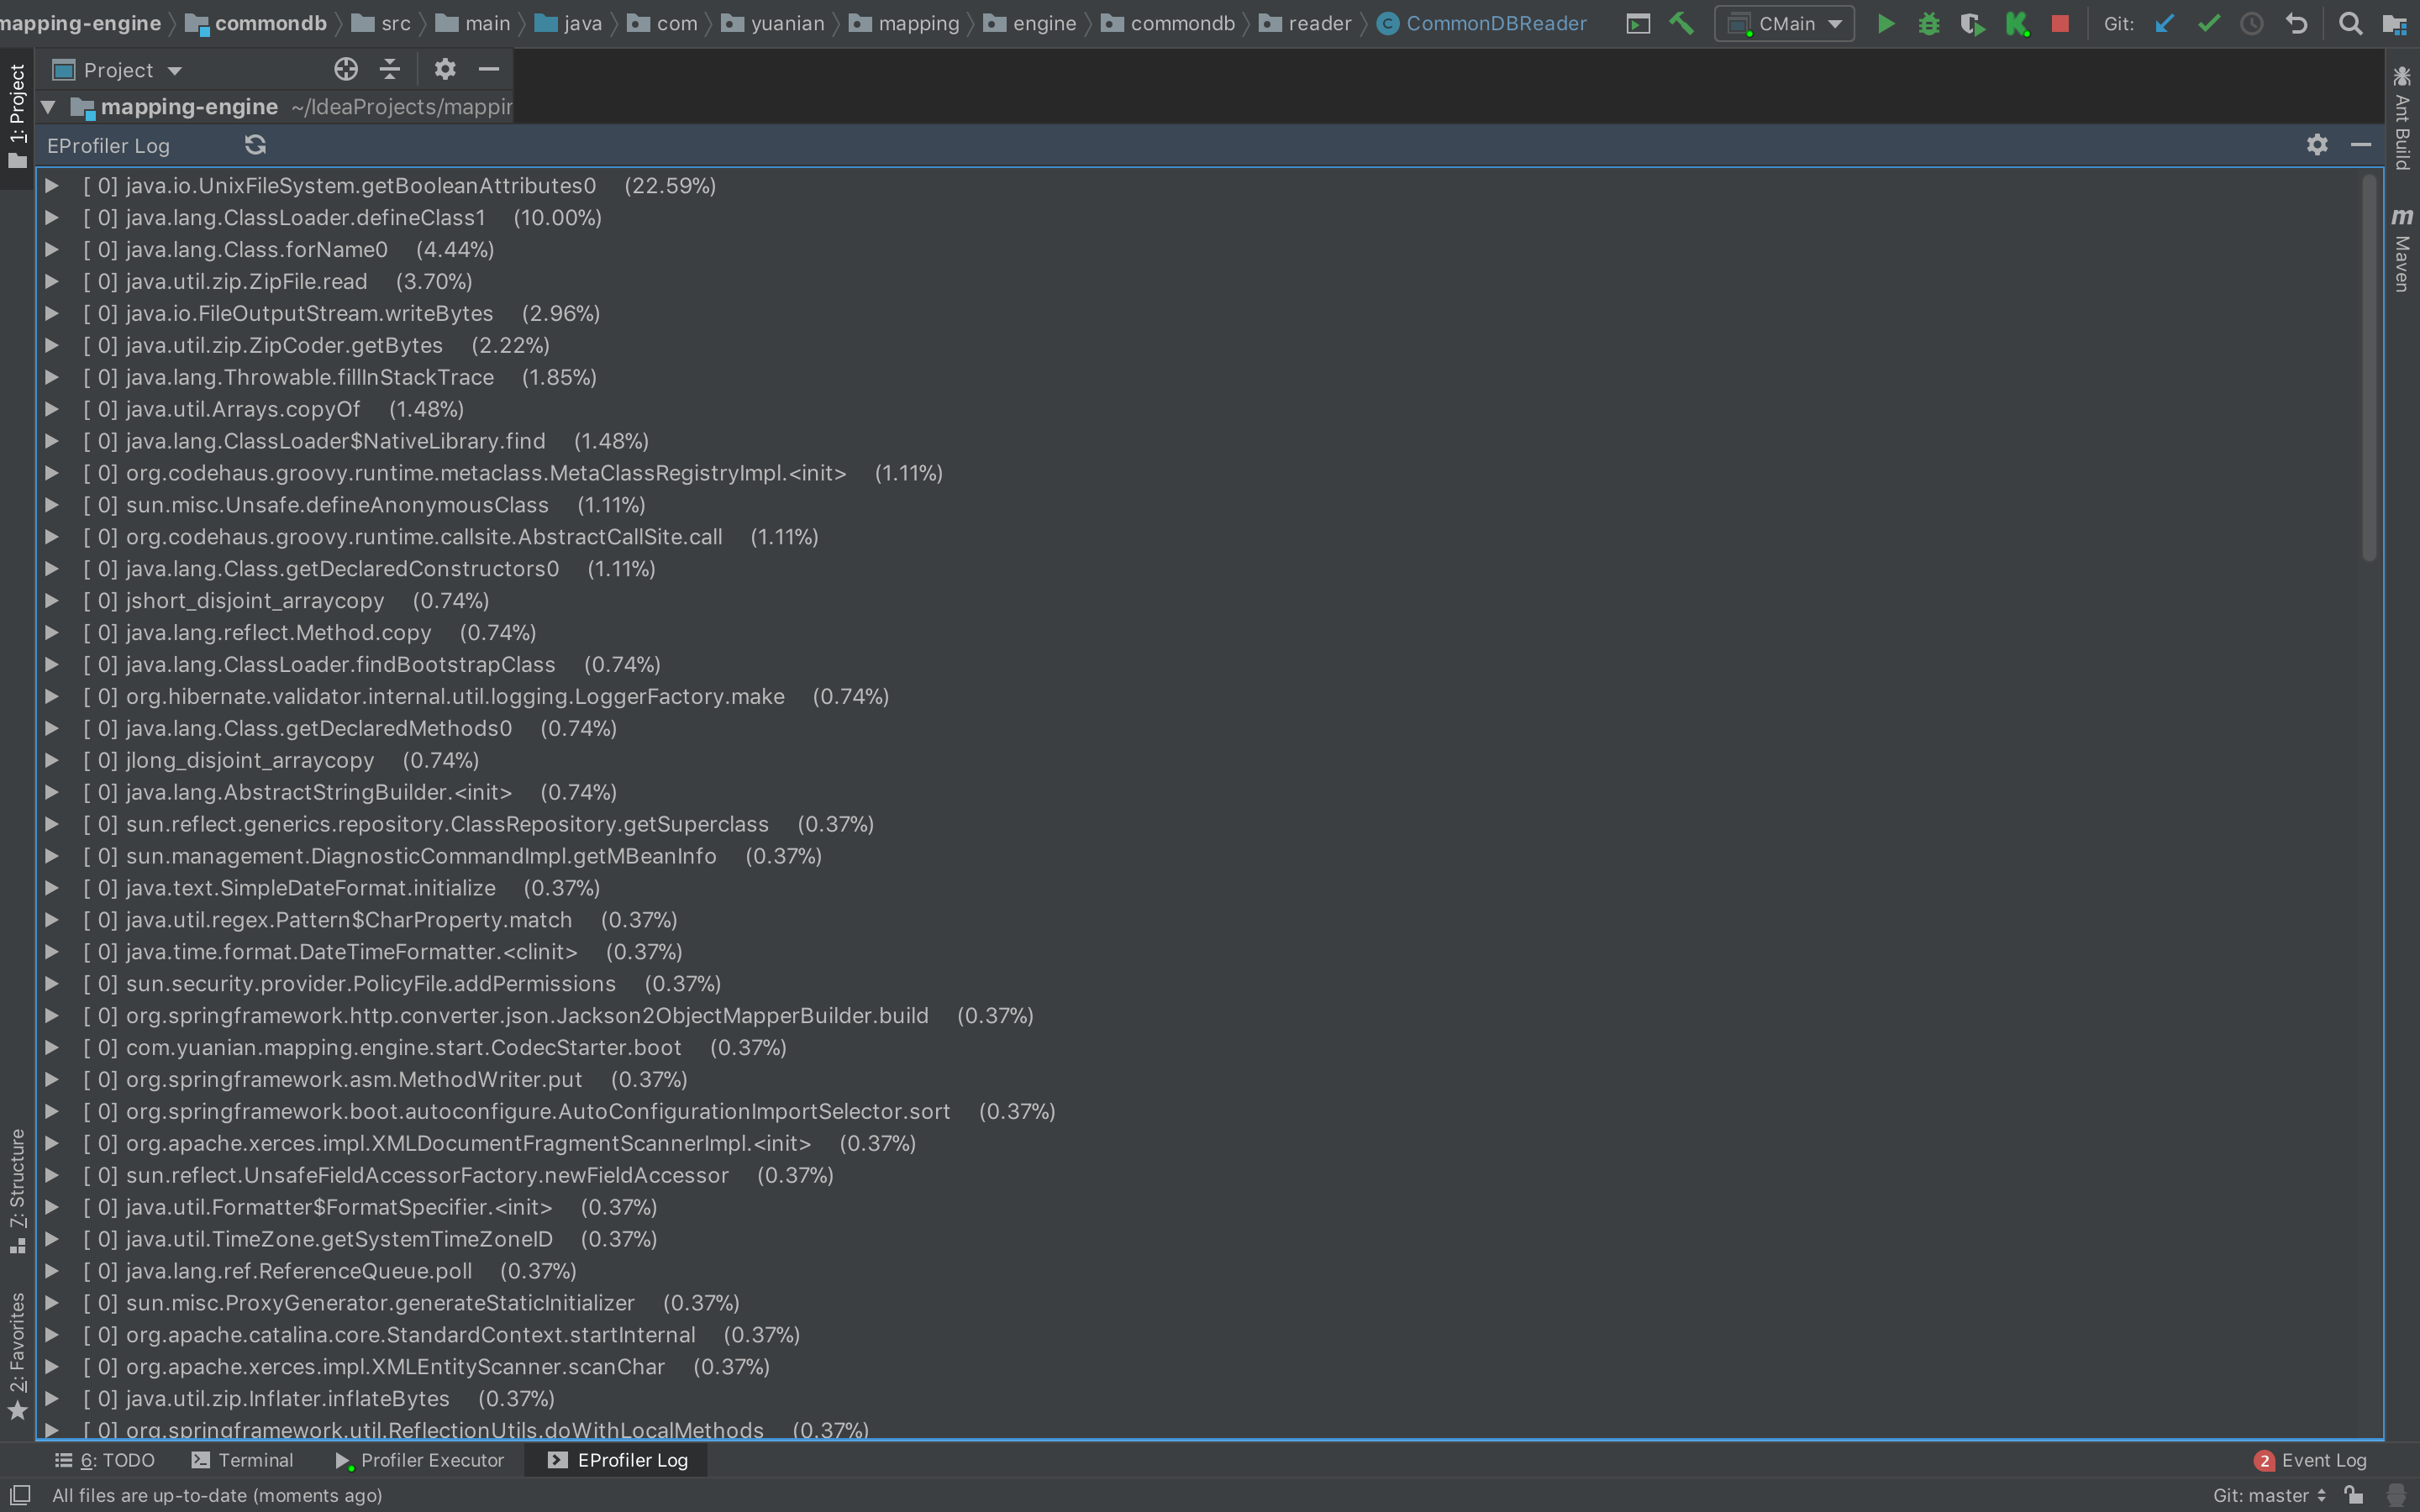
由于改日志是动态输出的,排在最前面的(百分比最高的)是当前项目消耗最高的性能点。默认5秒进行刷新输出,当点击具体的堆栈时会暂定刷新,点击刷新按钮会重新刷新分析结果日志。
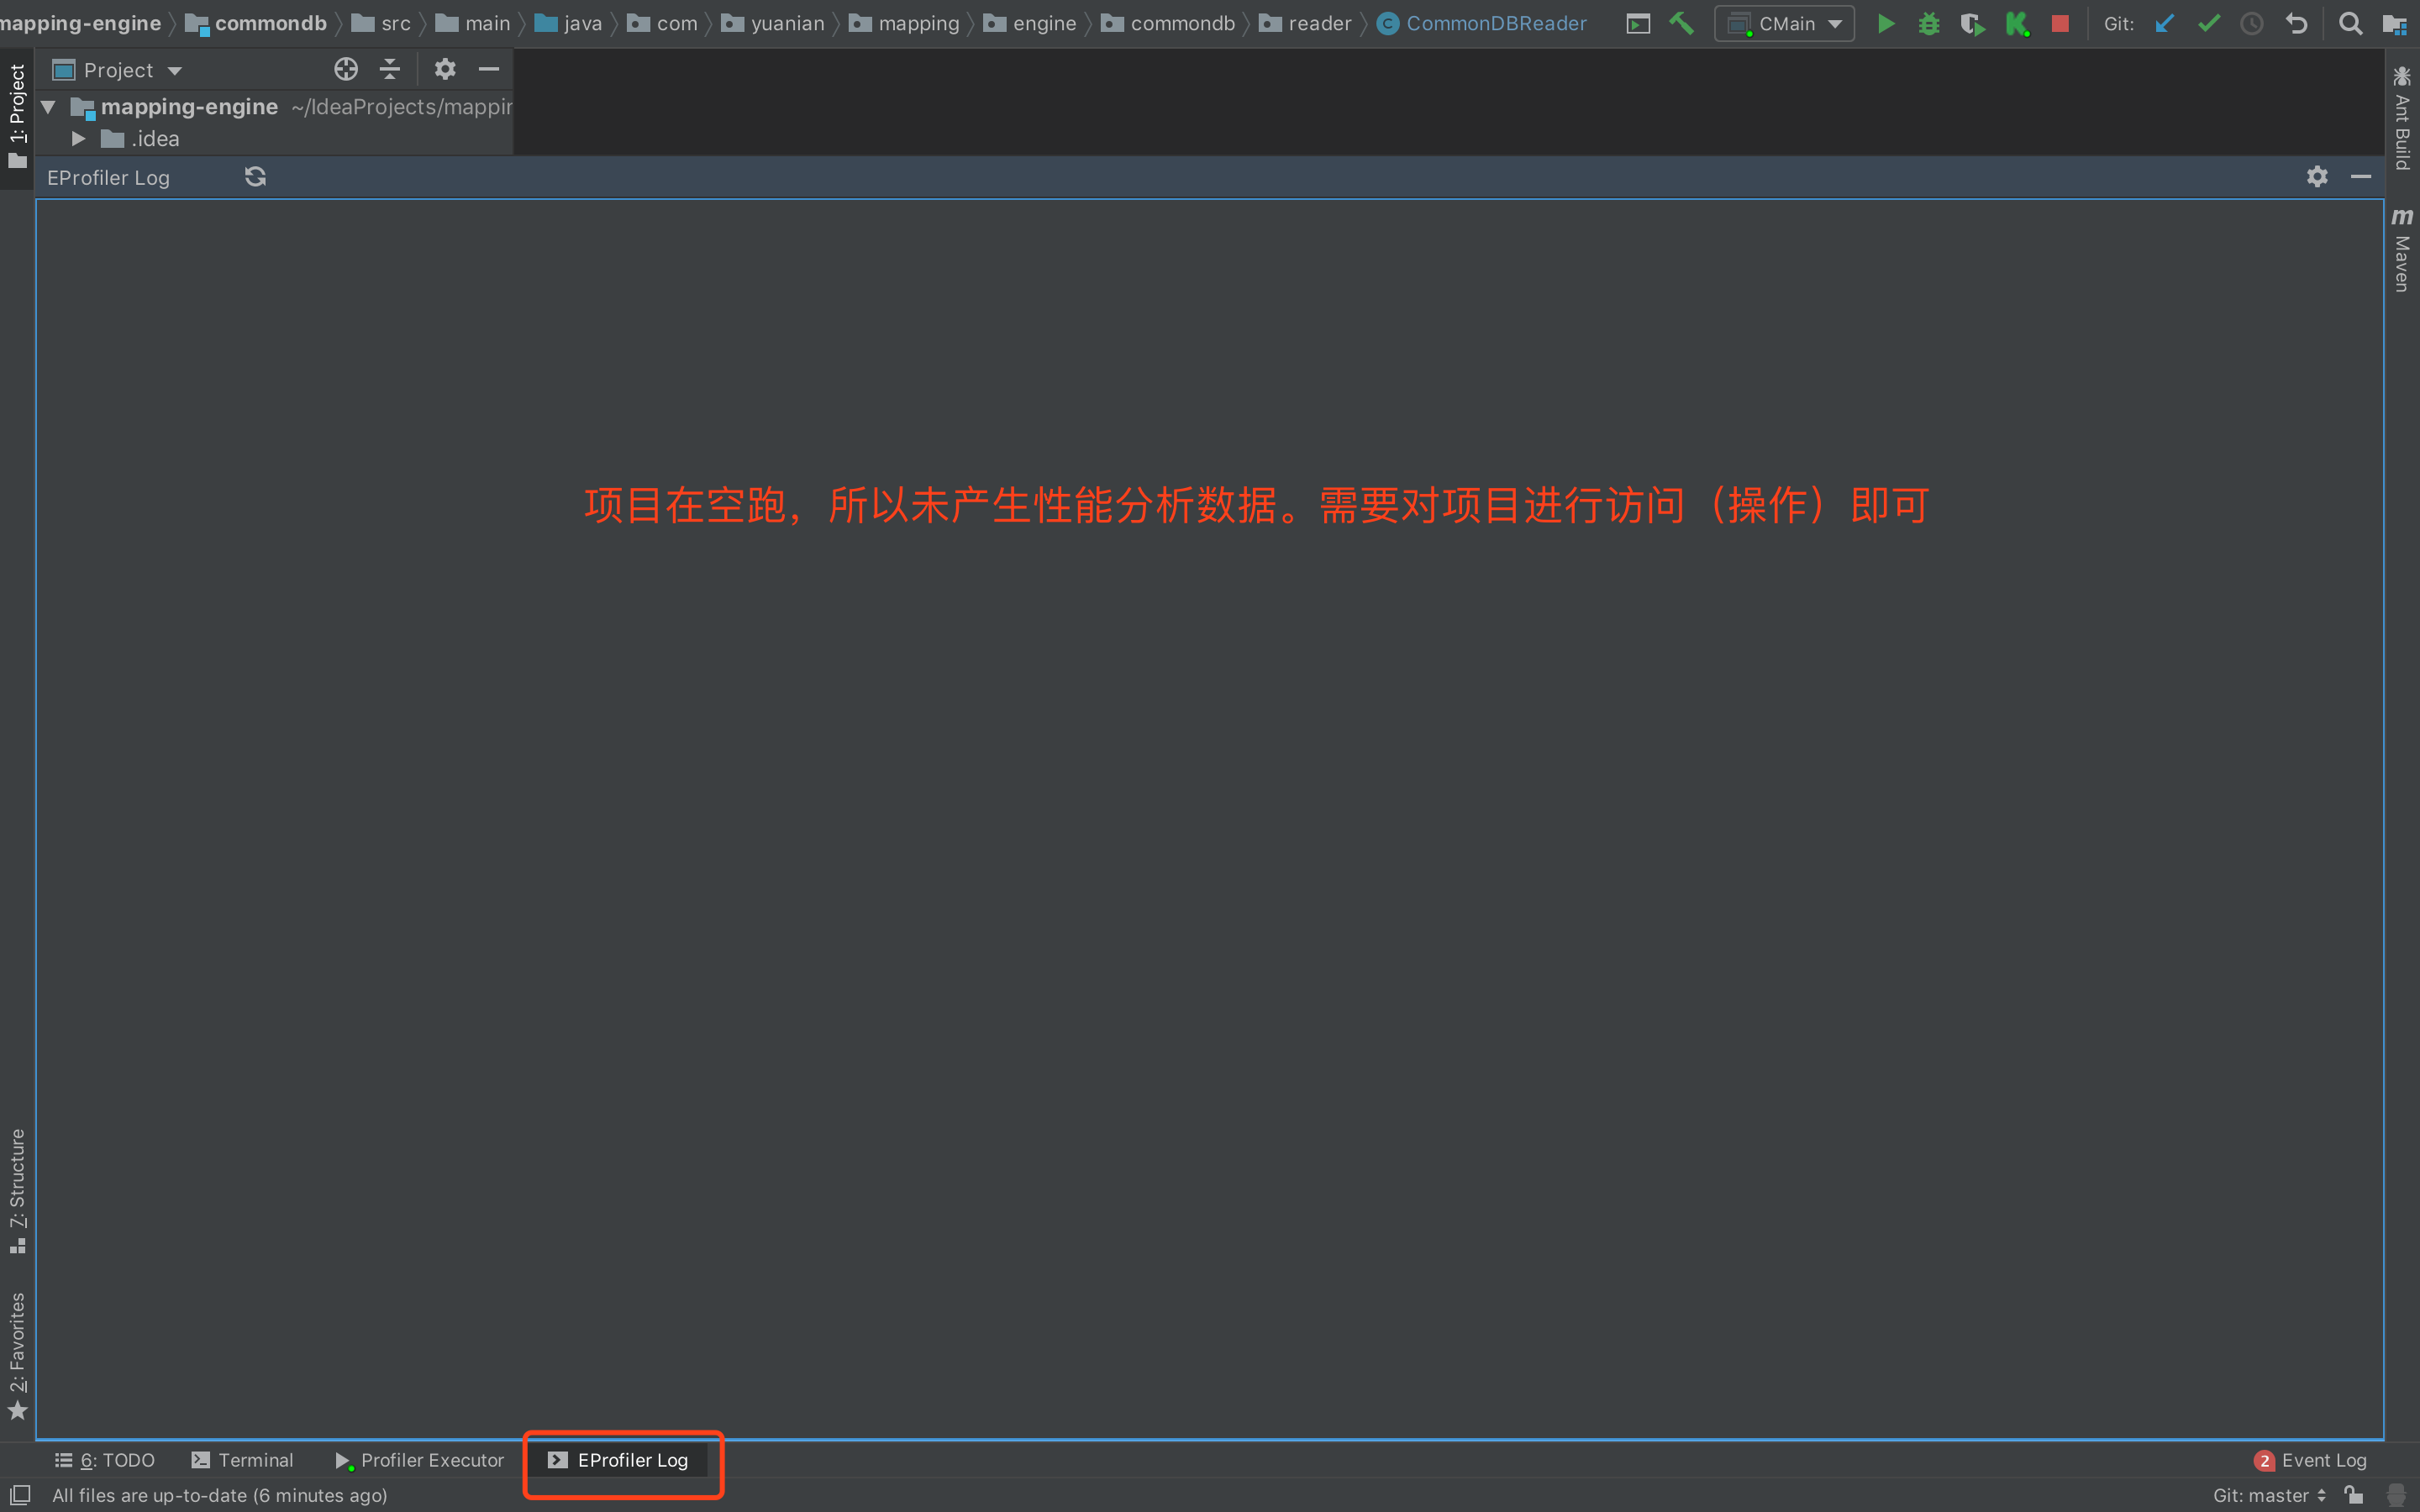
下面我开始访问项目空页面:
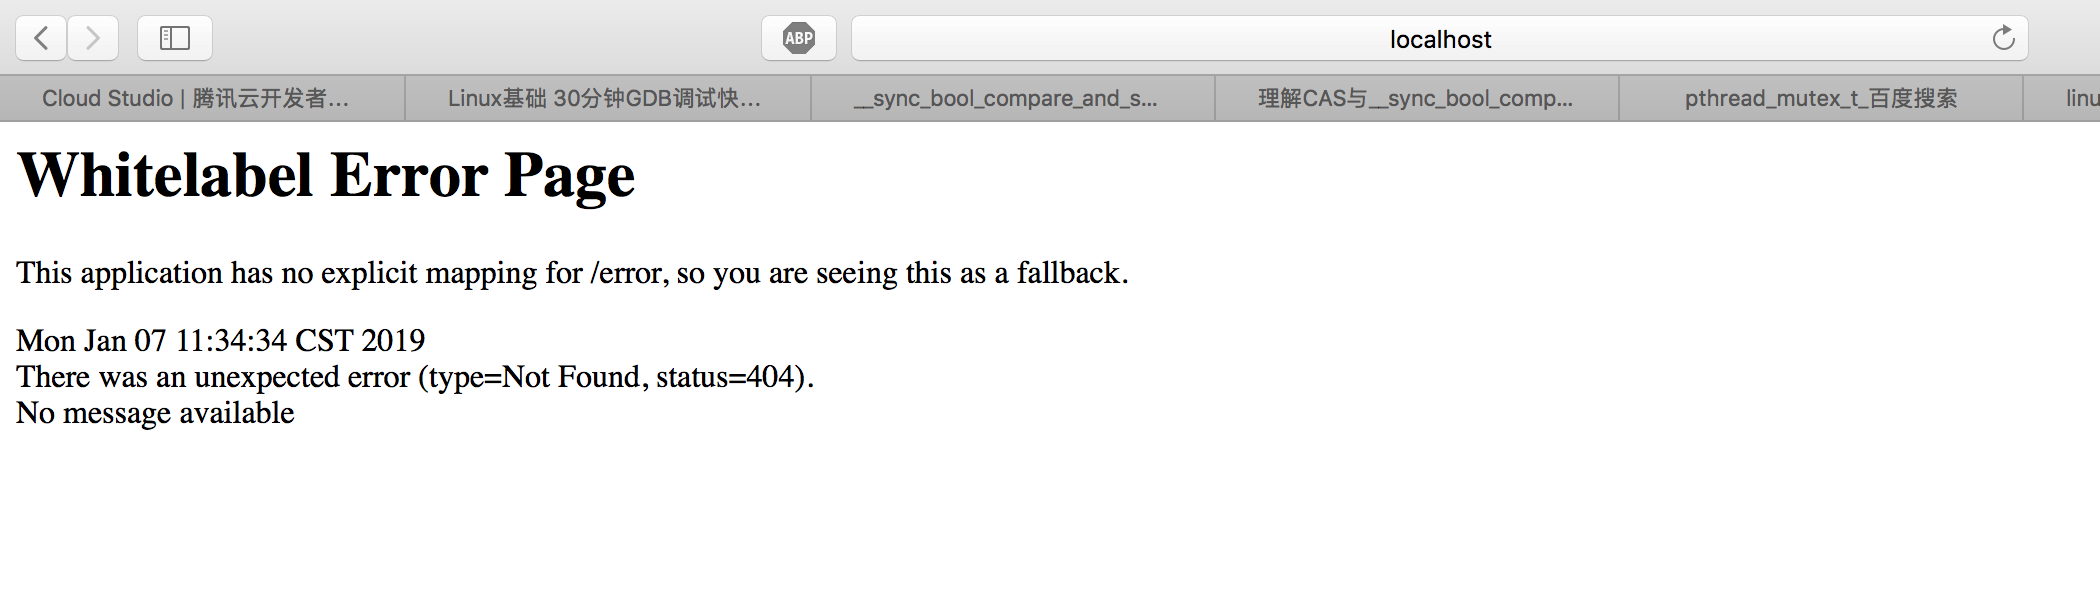
下面数据为强制刷新空页面后的数据