https://github.com/zonque/gas-tally
ESP8266 based gas meter monitor
https://github.com/zonque/gas-tally
energy-monitor esp8266 gas-sensor iot magnetometer
Last synced: 2 months ago
JSON representation
ESP8266 based gas meter monitor
- Host: GitHub
- URL: https://github.com/zonque/gas-tally
- Owner: zonque
- License: mit
- Created: 2022-07-24T11:03:03.000Z (almost 4 years ago)
- Default Branch: main
- Last Pushed: 2022-08-02T21:31:53.000Z (almost 4 years ago)
- Last Synced: 2025-03-23T19:17:08.656Z (over 1 year ago)
- Topics: energy-monitor, esp8266, gas-sensor, iot, magnetometer
- Language: C++
- Homepage:
- Size: 813 KB
- Stars: 1
- Watchers: 1
- Forks: 0
- Open Issues: 0
-
Metadata Files:
- Readme: README.md
- License: LICENSE
Awesome Lists containing this project
README
# Gas Tally
A little project to keep track of gas usage and log it to [InfluxDB](https://www.influxdata.com/) for vizualisation.
It's built with a D1 mini board, featuring an ESP8266 and an HMC5883 magnet sensor chip, connected via I2C.
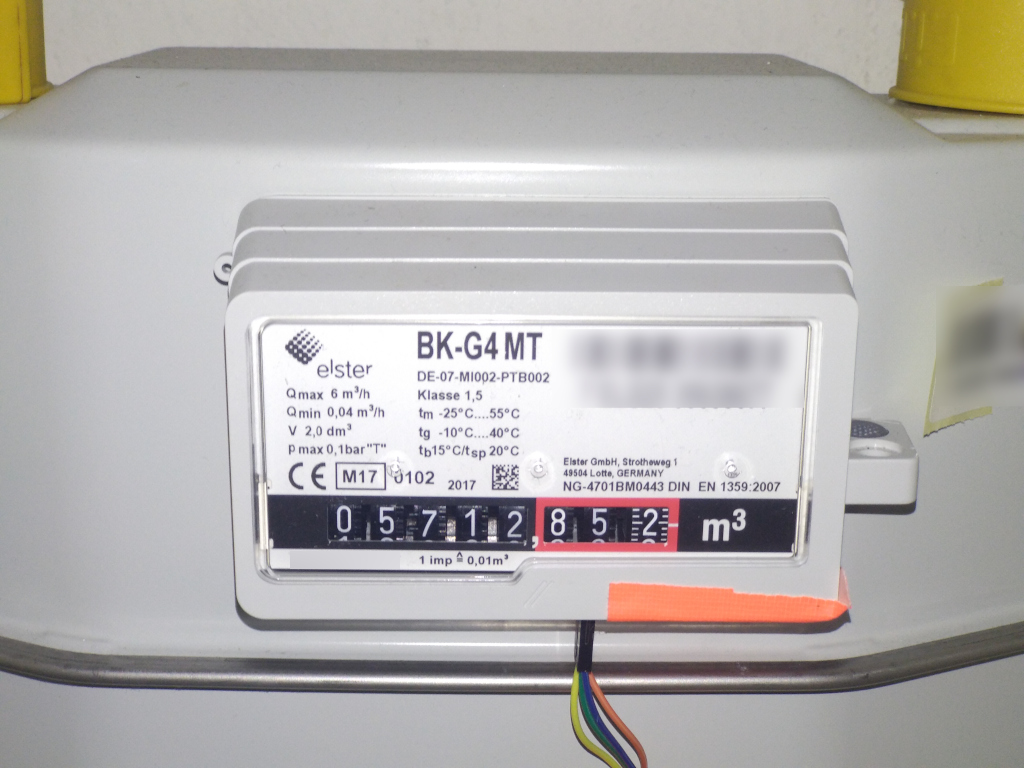
## Monitoring
Gas meters such as the the one pictured below have a small magnet in the last (rightmost) ring which
can be detected using a magnet sensor.
## Hardware wiring
A D1 mini module (ESP8266 based) was used and connected to an HMC5883 breakout board. Other ESP8266 derivates might also work.
Connect the I2C lines (SDA and SCL) and supply the HMC5883 board with +3.3v and GND. The DRDY pin can be left unconnected.

The sensor is then mounted underneath the gas meter. Duct tape is your friend :)

## Firmware details
The firmware will do the following upon startup:
* Initialize the HMC5883
* Connect to the configured Wifi
* Set the local time using NTP
* Connect to InfluxDB
It will then periodically (once per second) read out the sensor values and print them to the serial console.
The Z axis of the magnet sensor is further evaluated, assuming that the sensor is mounted flat on the bottom of the gas meter.
For the purposes of debouncing, its value will have to drop below the configured `MAGNET_THRESHOLD_LOW` value,
and then rise above `MAGNET_THRESHOLD_HIGH` again.
This event signifies a full turnaround of the measured ring. A data point is now logged to InfluxDB with a fixed value as
configured in `DATA_POINT_VALUE`.
## Compiling
You will need to have [PlatformIO](https://platformio.org/) set up in order to satisfy the dependency libraries and compile the firmware.
Copy `include/config.h.template` to `include/config.h` and add your configuration to the variables documented in that file.
## Influx
The easiest way to get started is to use [InfluxDB's hosted cloud service](https://cloud2.influxdata.com/signup).
Use InfluxDB queries to make use of the data. Note that the data represents multiple data points with the same value each,
so you need to select the `sum` aggregation to plot meaningful graphs.
For instance, use the following query:
```
from(bucket: "gas-tally")
|> range(start: v.timeRangeStart, stop: v.timeRangeStop)
|> filter(fn: (r) => r["_measurement"] == "usage")
|> filter(fn: (r) => r["_field"] == "m3")
|> filter(fn: (r) => r["sensor-id"] == "sensor-1")
|> aggregateWindow(every: 5m, fn: sum, createEmpty: true)
|> yield(name: "sum")
```
Here's an example of the plot that resulted from the query above:

## Homeassistant
[HomeAssistant](https://home-assistant.io) as support for Influx queries built-in. Here's an example config to display the measurements of your meter for the last hour, day and week:
```
- platform: influxdb
api_version: 2
ssl: true
host: XXX
port: 443
token: XXX
organization: XXX
bucket: gas-tally
queries_flux:
- range_start: -7d
name: Gas usage in the last 7 days
query: >
filter(fn: (r) => r["_measurement"] == "usage")
|> filter(fn: (r) => r["sensor-id"] == "my-sensor")
|> filter(fn: (r) => r["_field"] == "m3")
|> aggregateWindow(every: inf, fn: sum)
|> cumulativeSum()
value_template: "{{ value|float(0)|round(2) }} m^3"
- range_start: -24h
name: Gas usage in the last 24h
query: >
filter(fn: (r) => r["_measurement"] == "usage")
|> filter(fn: (r) => r["sensor-id"] == "my-sensor")
|> filter(fn: (r) => r["_field"] == "m3")
|> aggregateWindow(every: inf, fn: sum)
|> cumulativeSum()
value_template: "{{ value|float(0)|round(2) }} m^3"
- range_start: -1h
name: Gas usage in the last hour
query: >
filter(fn: (r) => r["_measurement"] == "usage")
|> filter(fn: (r) => r["sensor-id"] == "my-sensor")
|> filter(fn: (r) => r["_field"] == "m3")
|> aggregateWindow(every: inf, fn: sum)
|> cumulativeSum()
value_template: "{{ value|float(0)|round(2) }} m^3"
```
## License
MIT