Ecosyste.ms: Awesome
An open API service indexing awesome lists of open source software.
https://github.com/zrna/coronavirus-stats
:chart_with_upwards_trend: React JS | Coronavirus statistics with charts
https://github.com/zrna/coronavirus-stats
api chartjs reactjs redux redux-saga scss
Last synced: about 1 month ago
JSON representation
:chart_with_upwards_trend: React JS | Coronavirus statistics with charts
- Host: GitHub
- URL: https://github.com/zrna/coronavirus-stats
- Owner: Zrna
- Created: 2020-03-12T12:07:16.000Z (almost 5 years ago)
- Default Branch: master
- Last Pushed: 2023-05-08T13:35:38.000Z (over 1 year ago)
- Last Synced: 2024-10-12T10:18:22.972Z (2 months ago)
- Topics: api, chartjs, reactjs, redux, redux-saga, scss
- Language: JavaScript
- Homepage: https://zrna.github.io/coronavirus-stats/
- Size: 3.75 MB
- Stars: 0
- Watchers: 2
- Forks: 1
- Open Issues: 5
-
Metadata Files:
- Readme: README.md
Awesome Lists containing this project
README
# :chart_with_upwards_trend: Coronavirus Statistics :chart_with_upwards_trend:
## Description
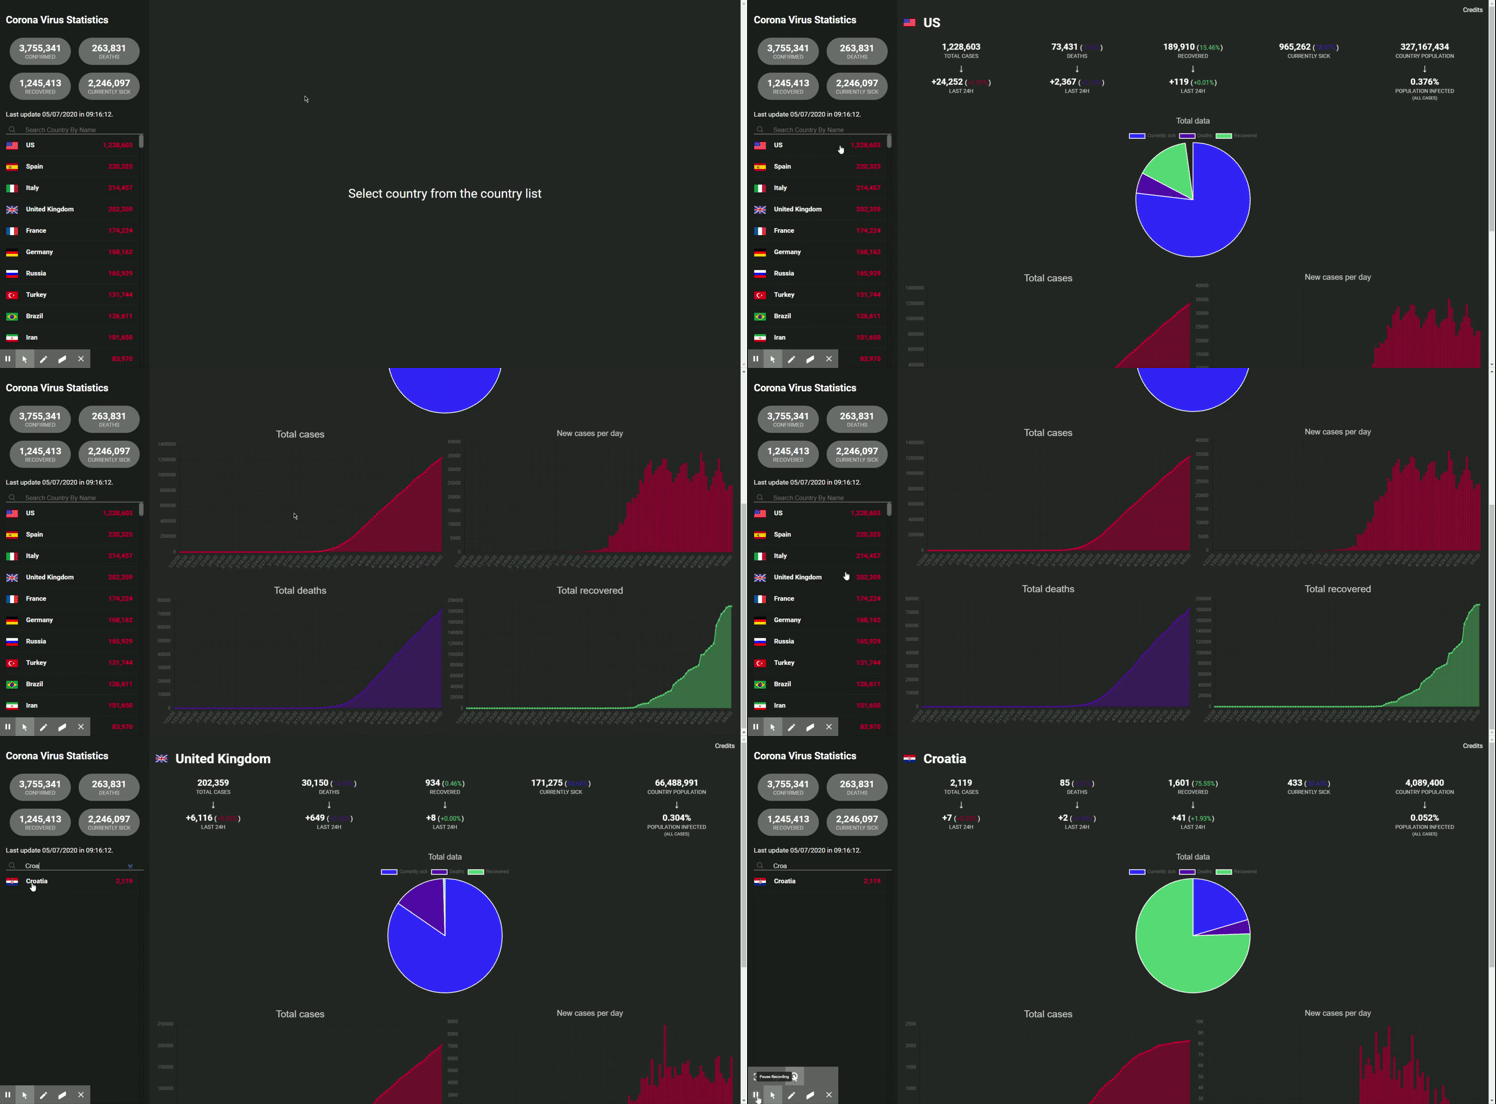
Coronavirus Statistic app which track Corona cases in the world.
Shows global statistics, but you can also choose a country separately.
Selecting a country displays data, statistics and graphs for that country only.
The application was created using: React JS, Redux, redux-saga, Chart.js (react-chartjs-2), SCSS, etc.
**Try app [here](https://zrna.github.io/coronavirus-stats/).**
## Preview

## Installation
1. Download or clone the project
2. Go into the project `cd coronavirus-stats`
3. Run `npm install`
4. Run `npm start`
### Data source / API
[coronavirus-tracker-api](https://github.com/ExpDev07/coronavirus-tracker-api)