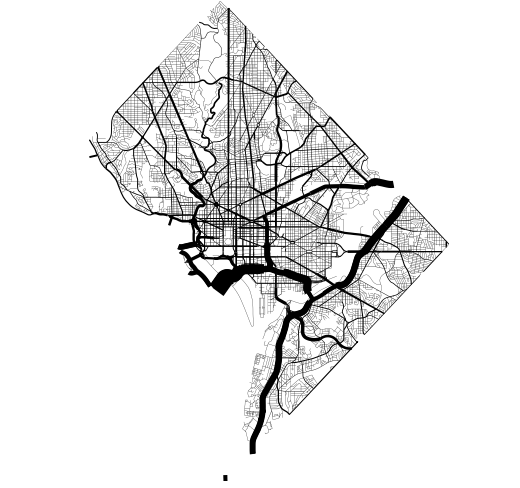
https://residentmario.github.io/geoplot/
High-level geospatial data visualization library for Python.
https://residentmario.github.io/geoplot/
geopandas geospatial-data geospatial-visualization matplotlib spatial-analysis
Last synced: 3 days ago
JSON representation
High-level geospatial data visualization library for Python.
- Host: GitHub
- URL: https://residentmario.github.io/geoplot/
- Owner: ResidentMario
- License: mit
- Created: 2016-06-29T00:11:33.000Z (almost 9 years ago)
- Default Branch: master
- Last Pushed: 2024-06-08T05:53:23.000Z (11 months ago)
- Last Synced: 2024-10-29T15:02:11.312Z (6 months ago)
- Topics: geopandas, geospatial-data, geospatial-visualization, matplotlib, spatial-analysis
- Language: Python
- Homepage: https://residentmario.github.io/geoplot/index.html
- Size: 138 MB
- Stars: 1,149
- Watchers: 35
- Forks: 95
- Open Issues: 29
-
Metadata Files:
- Readme: README.md
- Contributing: CONTRIBUTING.md
- License: LICENSE.md
Awesome Lists containing this project
- urban-and-regional-planning-resources - Geoplot - Geoplot is a high-level Python geospatial plotting library. It is an extension to cartopy and matplotlib which makes mapping easy: like seaborn for geospatial. (Planning Coding Resources / Python)
README
# geoplot: geospatial data visualization
[](https://github.com/conda-forge/geoplot-feedstock)    [](https://zenodo.org/record/3475569)
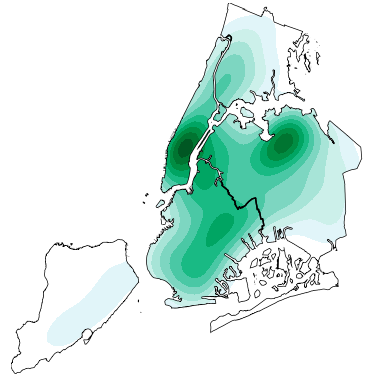
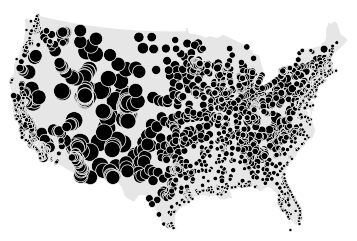
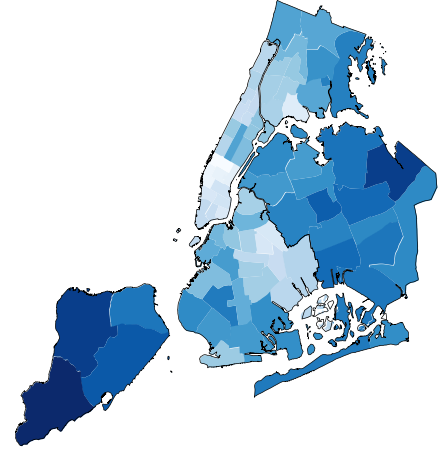
`geoplot` is a high-level Python geospatial plotting library. It's an extension to `cartopy` and `matplotlib` which makes mapping easy: like `seaborn` for geospatial. It comes with the following features:
* **High-level plotting API**: geoplot is cartographic plotting for the 90% of use cases. All of the standard-bearermaps that you’ve probably seen in your geography textbook are easily accessible.
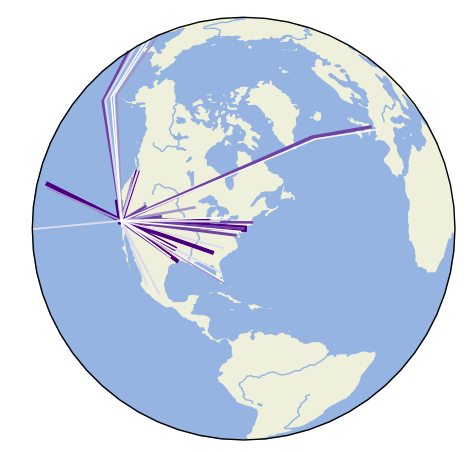
* **Native projection support**: The most fundamental peculiarity of geospatial plotting is projection: how do you unroll a sphere onto a flat surface (a map) in an accurate way? The answer depends on what you’re trying to depict. `geoplot` provides these options.
* **Compatibility with `matplotlib`**: While `matplotlib` is not a good fit for working with geospatial data directly, it’s a format that’s well-incorporated by other tools.
Installation is simple with `conda install geoplot -c conda-forge`. [See the documentation for help getting started](https://residentmario.github.io/geoplot/index.html).
----
Author note: `geoplot` is currently in a **maintenence** state. I will continue to provide bugfixes and investigate user-reported issues on a best-effort basis, but do not expect to see any new library features anytime soon.
