Ecosyste.ms: Awesome
An open API service indexing awesome lists of open source software.
https://github.com/adamewing/methylartist
Tools for plotting methylation data in various ways
https://github.com/adamewing/methylartist
Last synced: 4 months ago
JSON representation
Tools for plotting methylation data in various ways
- Host: GitHub
- URL: https://github.com/adamewing/methylartist
- Owner: adamewing
- License: mit
- Created: 2020-12-21T04:16:00.000Z (over 3 years ago)
- Default Branch: main
- Last Pushed: 2024-03-10T14:55:28.000Z (4 months ago)
- Last Synced: 2024-03-10T15:57:41.453Z (4 months ago)
- Language: Python
- Homepage:
- Size: 15.4 MB
- Stars: 100
- Watchers: 5
- Forks: 7
- Open Issues: 24
-
Metadata Files:
- Readme: README.md
- License: LICENSE
Lists
- repo-5916-awesome-genome-visualization - methylartist - genome-visualization/methylartist.png) (Long reads)
- awesome-genome-visualization - methylartist
README
## methylartist
Tools for parsing and plotting methylation patterns from nanopore data
## Installation
Available through pip and conda:
`pip install methylartist`
or
`conda install -c bioconda methylartist`
Alternatively:
`git clone https://github.com/adamewing/methylartist.git` or download a .zip file from GitHub.
Various tests/examples are availble at [methylartists-tests](https://github.com/adamewing/methylartist-tests):
```
git clone https://github.com/adamewing/methylartist-tests.git
cd methylartist-tests
source run_tests.sh
```
## Input data
### Alignments (.bam)
Alignments stored in .bam format should be sorted and indexed and should use the same read names as the associated methylation data.
### Modified Base Calls
The easiest way to provide modified basecall data is through .bam files with the `Mm` and `Ml` tags for modified base calling. Note that the `mod_mappings.bam` file output by megalodon will work for modified base calling, but is unsuitable for downstream applications involving sequence variation, including phasing.
If .bam files with modified base calls are not available, methylartist has functions for loading methylation data can from nanopolish, megalodon, or basecalled guppy fast5s, using the appropriate function below.
Once coverted, the sqlite .db file can be input to methylartist functions (e.g. `segplot`, `locus`, etc).
## Commands:
### db-nanopolish
Load nanopolish methylation into sqlite db.
Example:
Loading results from `nanopolish call-methylation` to a database:
```
methylartist db-nanopolish -m MCF7_ATCC_REP1.nanopolish.tsv.gz -d MCF7_ATCC.nanopolish.db
```
Appending additional results to the above database:
```
methylartist db-nanopolish -m MCF7_ATCC_REP2.nanopolish.tsv.gz -d MCF7_ATCC.nanopolish.db -a
```
Loading results with the current recommended cutoffs for nanopolish (abs(llr) > 2.0, scale grouped CpGs):
```
methylartist db-nanopolish -m MCF7_ATCC_REP1.nanopolish.tsv.gz,MCF7_ATCC_REP2.nanopolish.tsv.gz -d MCF7_ATCC.nanopolish.db -t 2.0 -s
```
Inputs can be uncompressed or .gzipped.
### db-megalodon
Load megalodon methylation into sqlite db.
The input file is the output of `megalodon_extras per_read_text modified_bases /path/to/megalodon_output`, which needs to be run prior to this script.
The default filename (`/path/to/megalodon_output/per_read_modified_base_calls.txt`) is the same for all megalodon runs, so the `--db` option is recommended to make the output database more identifiable for downstream analysis.
Example:
```
methylartist db-megalodon -m MCF7_ATCC_REP1/per_read_modified_base_calls.txt --db MCF7_ATCC.megalodon.db
```
Appending (`-a`) additional results to the above database:
```
methylartist db-megalodon -m MCF7_ATCC_REP2/per_read_modified_base_calls.txt --db MCF7_ATCC.megalodon.db -a
```
Input files can be uncompressed or .gzipped.
### db-custom
This enables free-form parsing of modified basecall tables into methylartist .db files for tools where modified base .bam files are not available and certain requirements are met. The table must contain, at a minimum, the read names, genomic position (chromosome and position), strand, and probability of the target base being modified. If not specified by a column (`--modbasecol`), the modification is specified by `--modbase`. The probability is assumed to be a raw probability between 0 and 1 of a given base being modified i.e. 1-p(canonical), other schemes may be used but `--canprob` and `--mincanprob` must be specified to set a column for canoncial base scores and a cutoff for a base being canonical.
For example, modified basecalls from [deepsignal-plant](https://github.com/PengNi/deepsignal-plant) can be loaded as follows:
`/home/taewing/methylartist/methylartist db-custom -m deepsignal_example.C.call_mods.tsv --readname 4 --chrom 0 --pos 1 --strand 2 --modprob 7 --modbase m -d deepsignal_example.db`
### segmeth
Outputs aggregate methylation / demethylation call counts over intervals. Required before generating strip / violin plots with `segplot`
Requires whitespace-delimited list of segments in a BED3+2 format: chromosome, start, end, label, strand.
One or more .bam files may be supplied via the `-b/--bams` parameter. Multiple .bams may be comma-delimited.
Optional sample input file `-d/--data` has the following whitespace-delimited fields (one sample per line): BAM file, Methylation DB (generated with e.g. `db-nanopolish`)
Highly recommend parallelising with `-p/--proc` option if possible.
Can be used to generate genome-wide methylation stats aggregated over windows via `bedtools makewindows`.
Example:
Aggregate whole-genome CpG methylation in 10kbp bins, promoters (Eukaryotic Promoter Database, EPD), L1HS and SVA retrotransposons:
```
methylartist segmeth -d MCF7_data_megalodon.txt -i MCF7_megalodon_annotations.bed -p 32
```
Contents of `MCF7_data_megalodon.txt`:
```
MCF7_ATCC.haplotag.bam MCF7_ATCC.megalodon.db
MCF7_ECACC.haplotag.bam MCF7_ECACC.megalodon.db
```
Contents of MCF7_megalodon_annotations.bed (first 10 lines):
```
chr1 0 10000 WG_10kbp
chr1 10000 20000 WG_10kbp
chr1 20000 30000 WG_10kbp
chr1 30000 40000 WG_10kbp
chr1 40000 50000 WG_10kbp
chr1 50000 60000 WG_10kbp
chr1 60000 70000 WG_10kbp
chr1 70000 80000 WG_10kbp
chr1 80000 90000 WG_10kbp
chr1 90000 100000 WG_10kbp
```
Output in ` MCF7_megalodon_annotations.segmeth.tsv` (first 10 lines):
```
seg_id seg_chrom seg_start seg_end seg_name seg_strand MCF7_ATCC.haplotag_m_meth_calls MCF7_ATCC.haplotag_m_unmeth_calls MCF7_ATCC.haplotag_m_no_calls MCF7_ATCC.haplotag_m_methfrac MCF7_ECACC.haplotag_m_meth_calls MCF7_ECACC.haplotag_m_unmeth_calls MCF7_ECACC.haplotag_m_no_calls MCF7_ECACC.haplotag_m_methfrac
chr1:0-10000 chr1 0 10000 WG_10kbp . 0 0 0 NaN 0 0 0 NaN
chr1:10000-20000 chr1 10000 20000 WG_10kbp . 4836 1205 893 0.8005297136235723 5994 1629 1254 0.7863046044864227
chr1:20000-30000 chr1 20000 30000 WG_10kbp . 1923 2641 802 0.42134092900964065 2093 3216 1032 0.39423620267470333
chr1:30000-40000 chr1 30000 40000 WG_10kbp . 974 790 273 0.5521541950113379 1331 821 416 0.6184944237918215
chr1:40000-50000 chr1 40000 50000 WG_10kbp . 361 398 149 0.4756258234519104 579 664 255 0.4658085277554304
chr1:50000-60000 chr1 50000 60000 WG_10kbp . 631 300 133 0.677765843179377 1086 472 242 0.6970474967907574
chr1:60000-70000 chr1 60000 70000 WG_10kbp . 315 494 130 0.38936959208899874 571 671 255 0.45974235104669886
chr1:70000-80000 chr1 70000 80000 WG_10kbp . 196 150 31 0.5664739884393064 288 214 79 0.5737051792828686
chr1:80000-90000 chr1 80000 90000 WG_10kbp . 297 122 29 0.7088305489260143 127 57 16 0.6902173913043478
```
### segplot
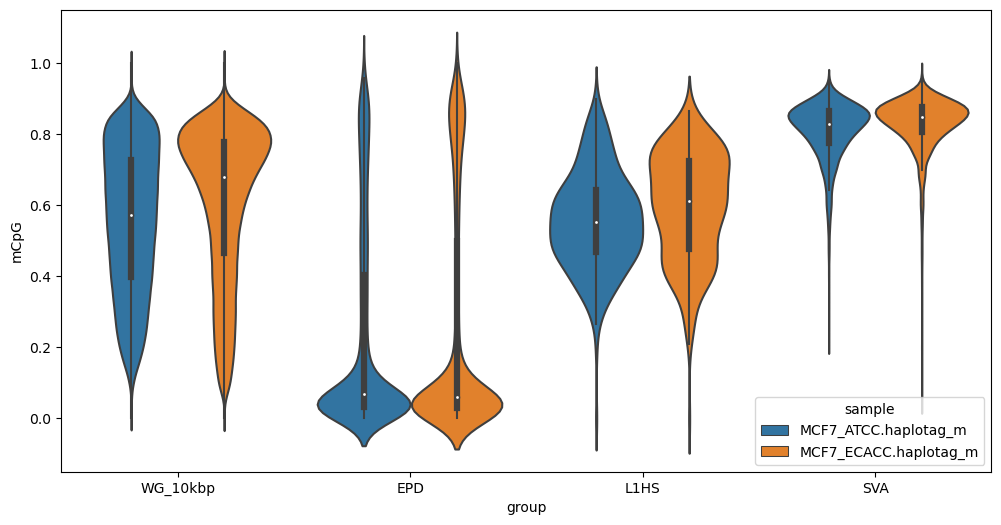
Generates strip plots or violin plots (`-v/--violin`) from `segmeth` output.
Examples:
Strip plot of whole-genome CpG methylation in 10kbp bins, promoters (Eukaryotic Promoter Database, EPD), L1HS and SVA retrotransposons:
```
methylartist segplot -s MCF7_megalodon_annotations.segmeth.tsv
```

As above, but use violin plots:
```
methylartist segplot -s MCF7_megalogon_annotations.segmeth.tsv -v
```
Note that default output is in .png format. For .svg vector output suitable for editing in inkscape or illustrator add the `--svg` option. Note that for strip plots, this is often inadvisable due to the large number of points.
New in 1.0.7, ridge plots (`-g/--ridge`):
```
methylartist segplot -s L1_FL.MCF7_data_megalodon.segmeth.tsv -c L1HS,L1PA2,L1PA3,L1PA4,L1PA5,L1PA6,L1PA7,L1PA8 -g --palette magma
```
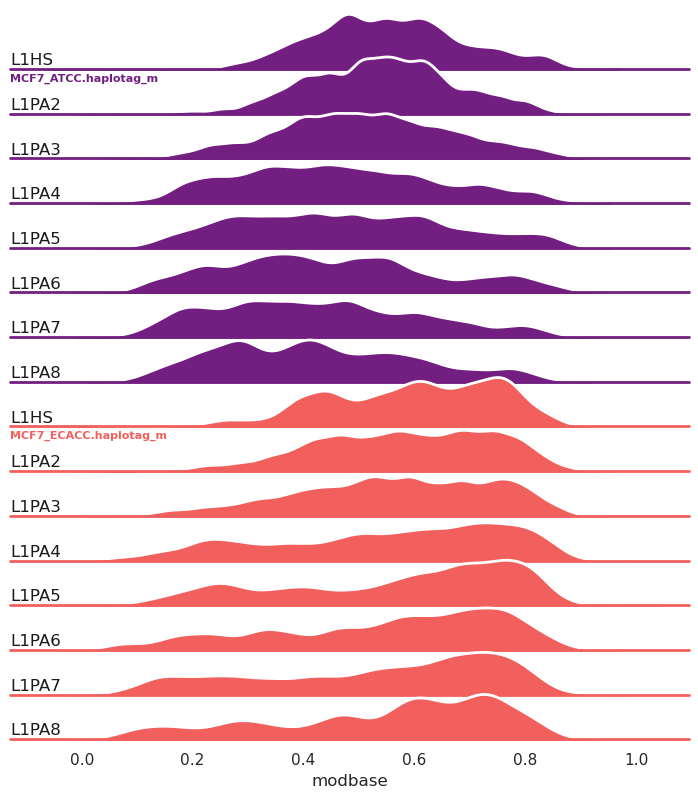
Ridge plots can also be grouped by annotation (`--ridge_group_by_annotation`) rather than by sample as in the above example.
### locus
Generates smoothed methylation profiles across specific loci with many configurable parameters for one or more samples.
One or more .bam files (with Mm/Ml tags) may be supplied via the `-b/--bams` parameter. Multiple .bams may be comma-delimited.
Optional sample input file `-d/--data` has the following whitespace-delimited fields (one sample per line): BAM file, Methylation DB (generated with e.g. `db-nanopolish`)
Example:
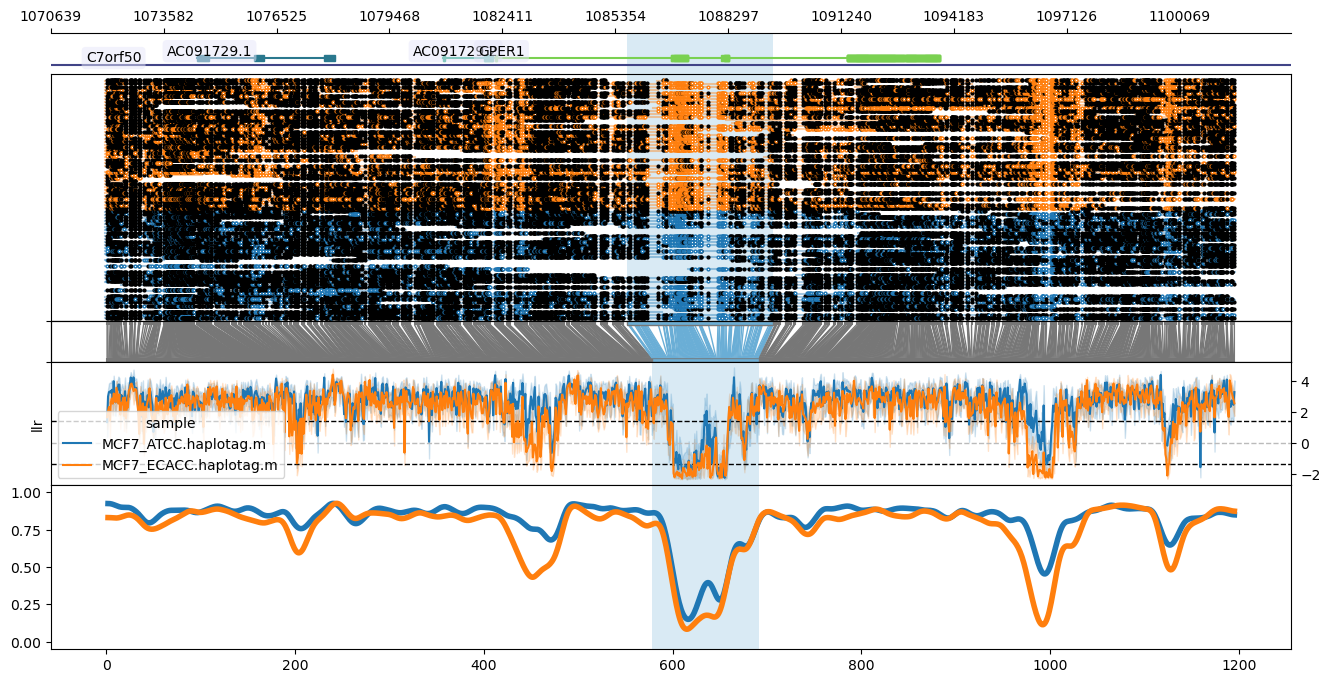
Plot of the GPER1 locus in hg38, highlighting the GeneHancer promoter/enhancer annotation (`GH07J001085`).
```
methylartist locus -d MCF7_data_megalodon.txt -i chr7:1072064-1101499 -g Homo_sapiens.GRCh38.97.chr.sorted.gtf.gz --genes GPER1 -l 1085667-1089471 -p 1,6,1,3,4
```
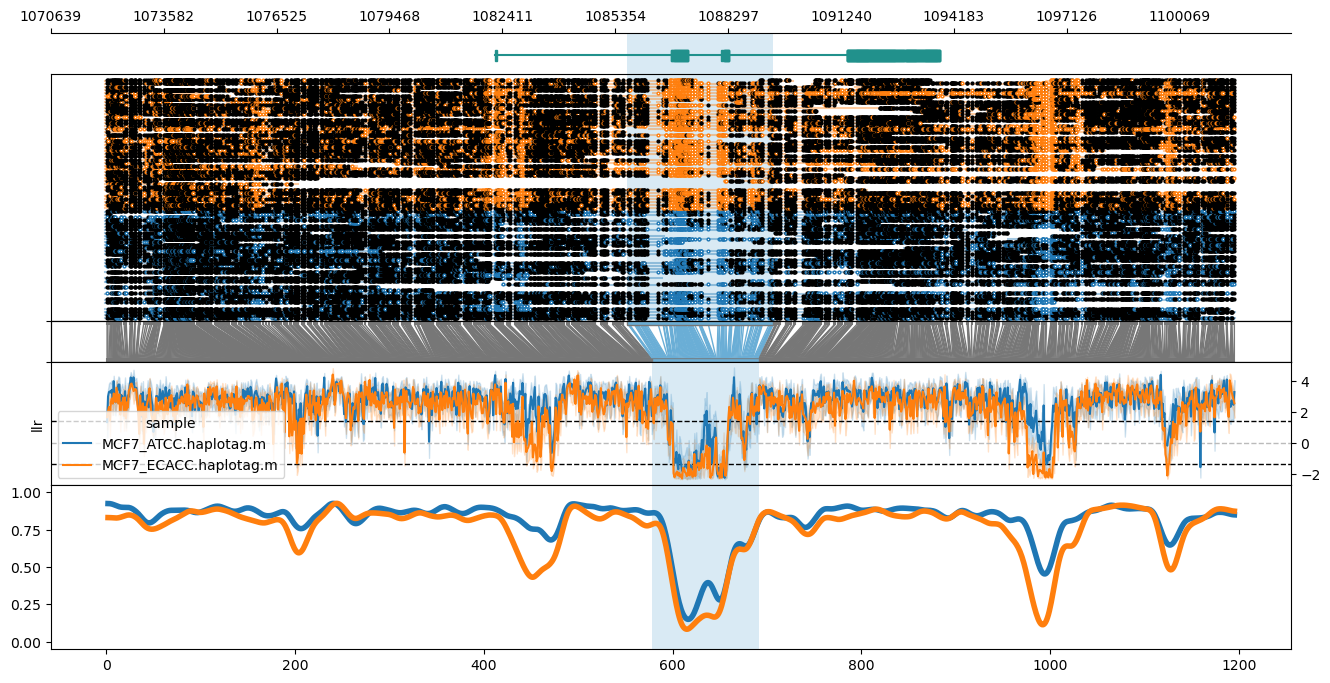
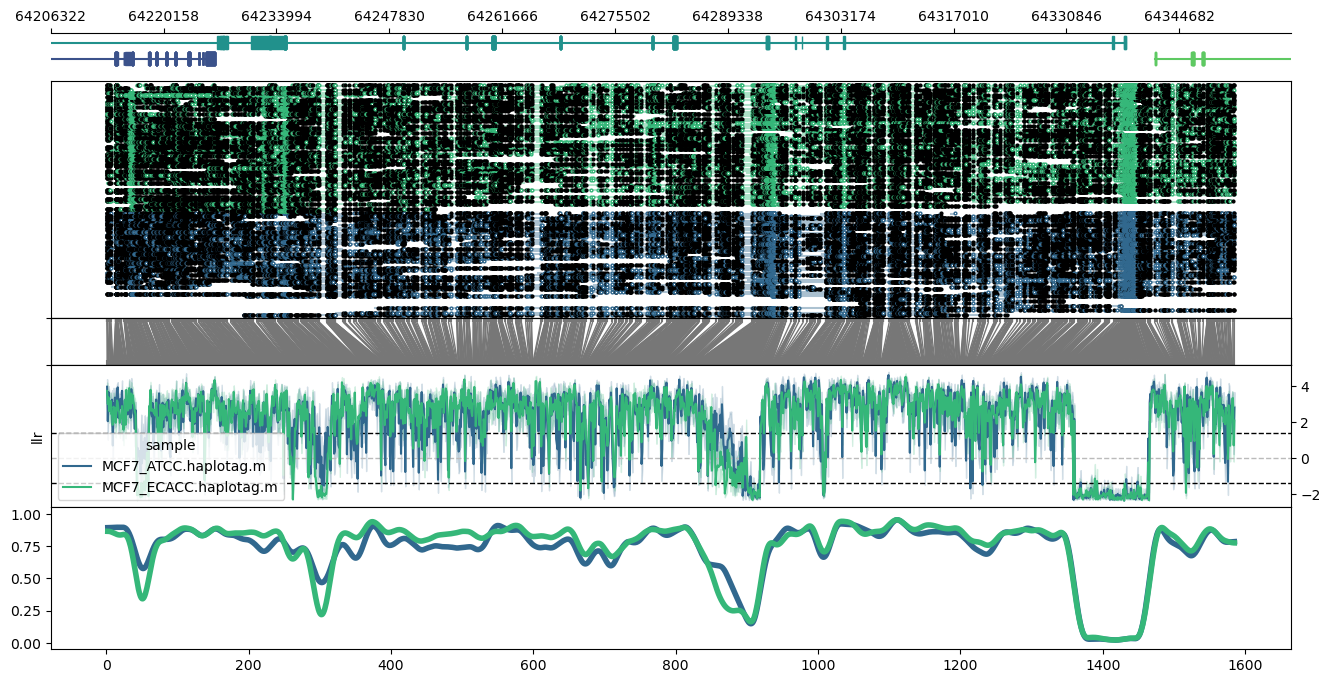
From top to bottom, the plot shows the genome coordinates, gene models (optional if `--gtf` is supplied), read mappings with modified bases as closed (modified) or open (unmodified) circles, translation from genome to CpG-only coordinate space, raw log-likelihood ratios, and smoothed methylated fraction plot. Note that `--genes` results in plotting only the genes specified after `--genes` (comma-delimited), leaving this out plots all genes across the window. Gene name labels can be added via `--labelgenes`:
```
methylartist locus -d MCF7_data_megalodon.txt -i chr7:1072064-1101499 -g Homo_sapiens.GRCh38.97.chr.sorted.gtf.gz -l 1085667-1089471 -p 1,6,1,3,4 --labelgenes
```
#### Custom sample and highlight colours
Examples:
Plot of the ESR2 locus using the `--samplepalette` option:
```
methylartist locus -d MCF7_data_megalodon.txt -i chr14:64213064-64351433 --gtf Homo_sapiens.GRCh38.97.chr.sorted.gtf.gz --genes ESR2,SYNE2,TEX21P --samplepalette viridis
```
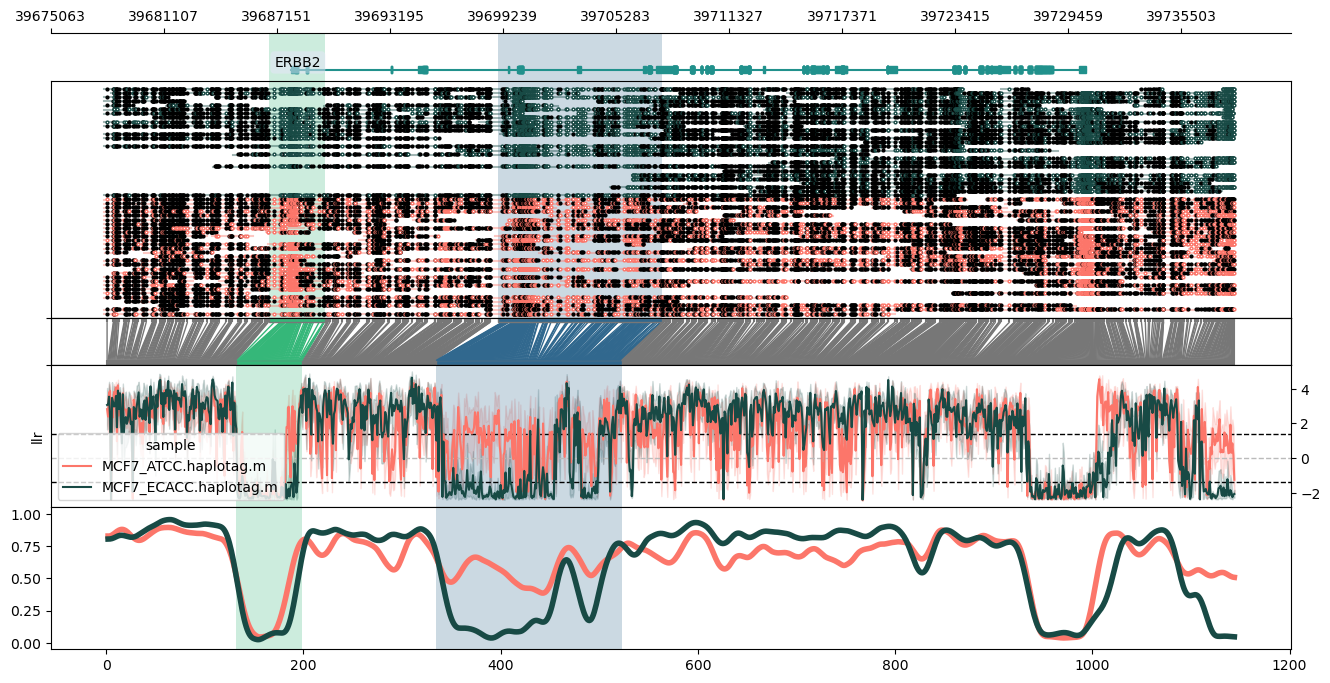
Plot of the ERBB2 (HER2) locus in hg38, using a data input file (`-d`) with custom colour specification:
```
methylartist locus -d MCF7_data_megalodon.colours.txt -i chr17:39677914-39738361 -g Homo_sapiens.GRCh38.97.chr.sorted.gtf.gz --genes ERBB2 --highlight_bed erbb2.highlights.txt --highlightpalette viridis --labelgenes
```
Contents of `MCF7_data_megalodon.colours.txt`:
```
MCF7_ATCC.haplotag.bam MCF7_ATCC.megalodon.db #FC766A
MCF7_ECACC.haplotag.bam MCF7_ECACC.megalodon.db #184A45
```
Contents of `erbb2.highlights.txt`:
```
chr17 39686731 39689728
chr17 39698981 39707766
```
#### phasing
Use the `--phased` flag to produce haplotype-aware methylation profiles. Requires haplotypes to be tagged with whatshap.
Examples:
Plot of the PEG3 imprinted region on chromosome 19, hg38.
```
methylartist locus -d MCF7_data_megalodon.txt -i chr19:56810076-56870725 -l 56835376-56840476 -g Homo_sapiens.GRCh38.97.chr.sorted.gtf.gz --genes PEG3 --slidingwindowsize 20 -s 36 --samplepalette viridis --phased
```
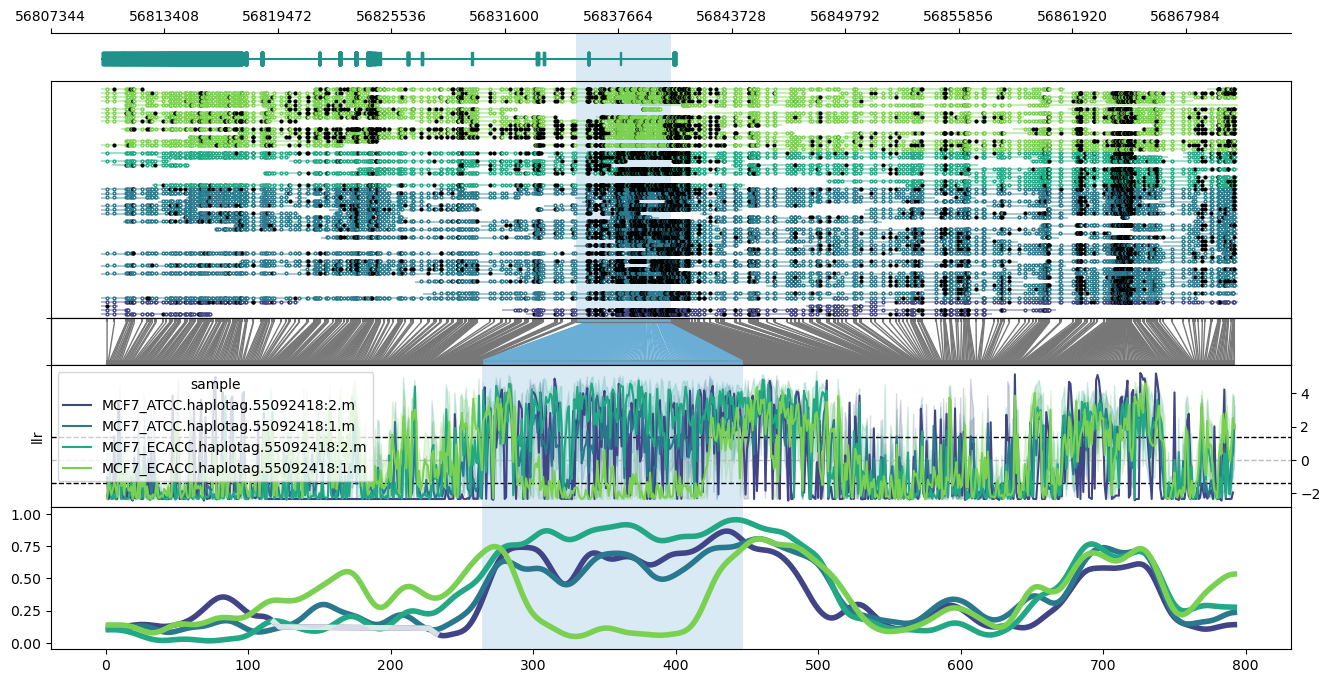
Note the apparent differential imprinting between the ATCC and ECACC MCF7 lines.
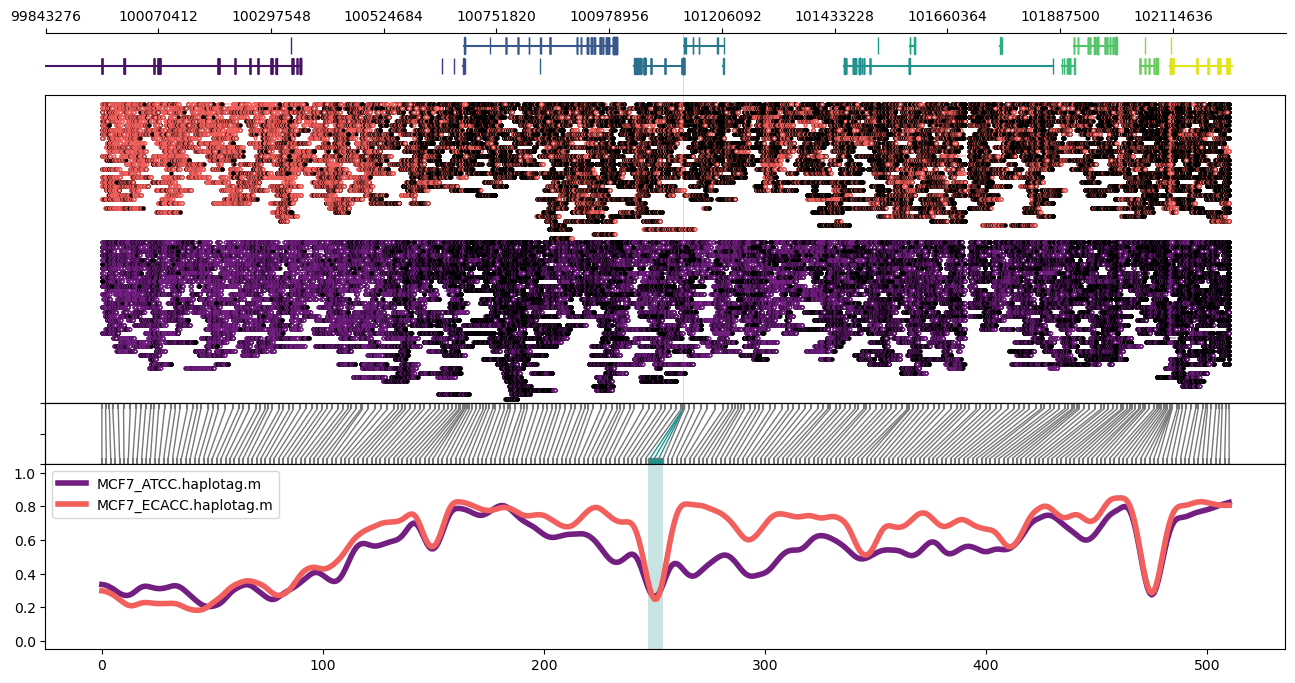
### region
More tractable than "locus" for larger regions using binned methylation.
Example:
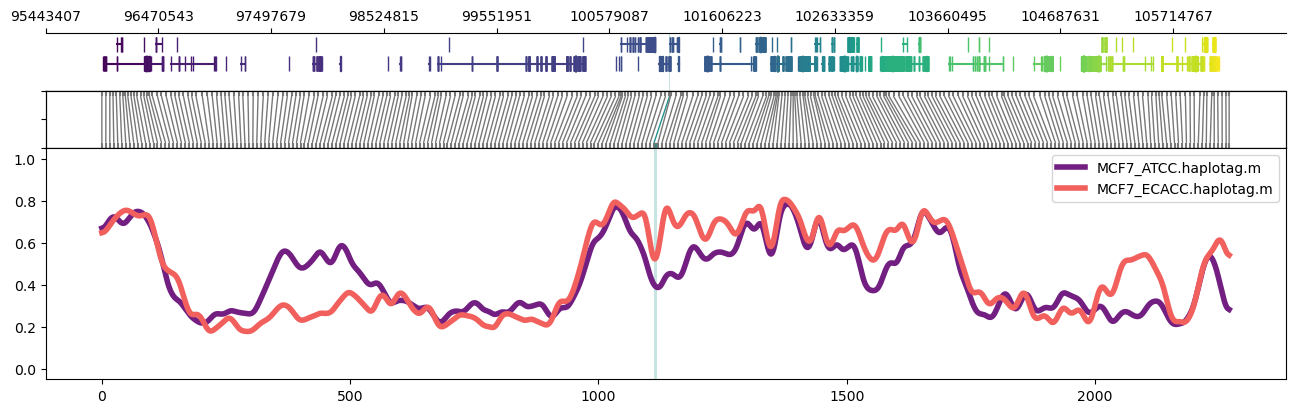
Plot of the PGR (Progesterone Receptor) region on chr11 in MCF7 cells. Highlighed region corresponds to the GeneHancer annotation `GH11J101126`. Note the parameter setting `-n CG` to normalised bins for content of CpG dinucleotides. Options `--samplepalette` and `--highlightpalette` are used to set colours. The number of windows and smoothing parameters are set automatically but can be modified from automatically set values via `-w/--windows` and `-s/--smoothwindowsize`.
```
methylartist region -i chr11:100956822-101228191 -d MCF7_data_megalodon.txt -g Homo_sapiens.GRCh38.97.chr.sorted.gtf.gz -p 32 -n CG -r Homo_sapiens_assembly38.fasta --samplepalette magma -l 101126888-101129371 --highlightpalette viridis
```

Expanded to a larger ~2Mbp region:
```
methylartist region -i chr11:98956822-103228191 -d MCF7_data_megalodon.txt -g Homo_sapiens.GRCh38.97.chr.sorted.gtf.gz -p 32 -n CG -r Homo_sapiens_assembly38.fasta --samplepalette magma -l 101126888-101129371 --highlightpalette viridis
```
For an even larger region, it helps to drop the read alignment panel:
```
methylartist region -i chr11:95956822-106228191 -d MCF7_data_megalodon.txt -g Homo_sapiens.GRCh38.97.chr.sorted.gtf.gz -p 32 -n CG -r Homo_sapiens_assembly38.fasta --samplepalette magma -l 101126888-101129371 --highlightpalette viridis --skip_align_plot --panelratio 1,0,1,4 --height 4.5
```
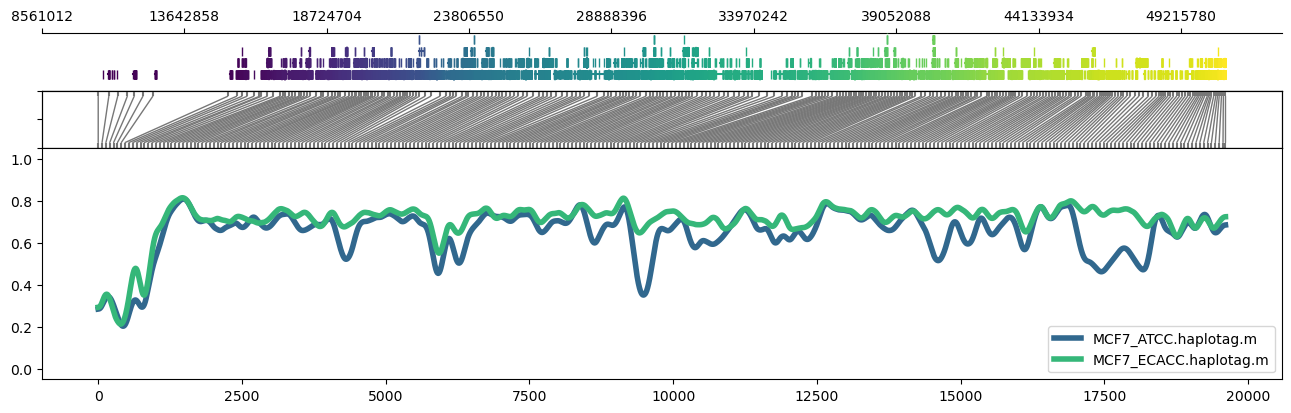
It's also possible to use region plots to explore methylation profiles across entire chromosomes. This can be accomplished through turning off the read alignment plot with `--skip_align_plot` and adjusting `--panelratios` to set the read alignment plot panel to 0. Setting the image height via `--height 4.5` maintains similar panel heights to the default.
Example:
```
methylartist region -i chr22:1-50818468 -d MCF7_data_megalodon.txt -p 32 -g Homo_sapiens.GRCh38.97.chr.sorted.gtf.gz -n CG -r Homo_sapiens_assembly38.fasta --skip_align_plot --panelratios 1,0,1,4 --height 4.5 --genepalette viridis --samplepalette viridis
```
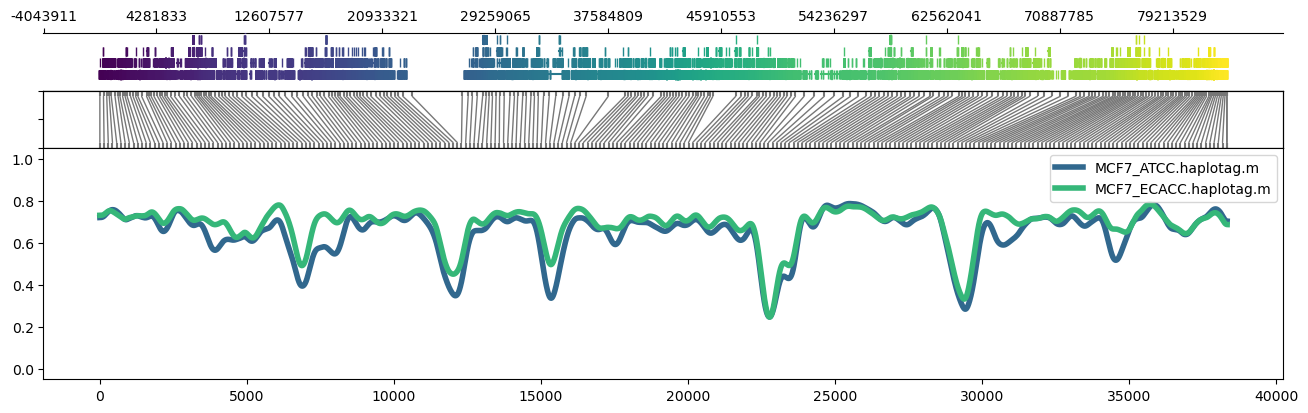
```
methylartist region -i chr17:1-83257441 -d MCF7_data_megalodon.txt -p 32 -g Homo_sapiens.GRCh38.97.chr.sorted.gtf.gz -n CG -r Homo_sapiens_assembly38.fasta --skip_align_plot --panelratios 1,0,1,4 --height 4.5 --genepalette viridis --samplepalette viridis
```
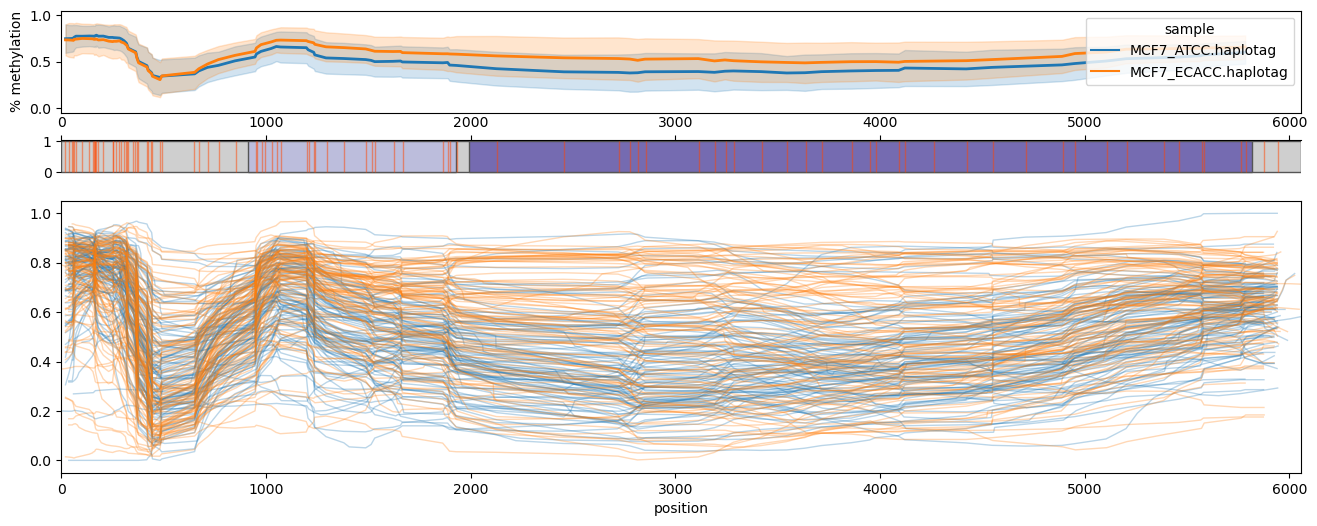
### composite
Generates "composite" methylation plots where multiple per-element profiles are aligned to and plotted against a reference sequence.
Example:
The contents of `L1HS.bed` are formatted as follows (first 10 lines), derived from hg38 repeatmasker .out files:
```
chr1 34566056 34572105 L1HS -
chr1 67078892 67084915 L1HS -
chr1 71513699 71519742 L1HS +
chr1 80939204 80945257 L1HS -
chr1 84052390 84058406 L1HS -
chr1 85748520 85754548 L1HS +
chr1 85927068 85933100 L1HS +
chr1 86679081 86685111 L1HS -
chr1 104770248 104776278 L1HS -
chr1 104843834 104849864 L1HS -
```
The consensus sequence for establishing a common coordinate system is in `L1.3.fa` (fasta formatted with one sequence), available here: [L19088.1](https://www.ncbi.nlm.nih.gov/nuccore/L19088.1)
The contents of `L1.3.highlights.bed` used for optional highlighting of regions (ORF1 and ORF2 in this case):
```
910 1926 ORF1 #bcbddc
1990 5817 ORF2 #756bb1
```
Command to `methylartist composite` (note the parsing of individual profiles can be parallelised via `-p`):
```
methylartist composite -d MCF7_data_megalodon.txt -s L1HS.bed -r Homo_sapiens_assembly38.fasta -t L1.3.fa -p 32 --blocks L1.3.highlights.bed
```
(adjust number of processes used for computing individual profiles via `-p/--procs` to be appropriate for your system)
### wgmeth
Outputs genome-wide statistics on CpGs covered by at least one call. By default, `wgmeth` yields output in bedMethyl format (0-based coordinates):
```
chr1 10467 10468 MCF7_ECACC.nanopolish 3 . 10467 10468 0,0,0 3 1.0
chr1 10469 10470 MCF7_ECACC.nanopolish 3 . 10469 10470 0,0,0 3 1.0
chr1 10482 10483 MCF7_ECACC.nanopolish 7 . 10482 10483 0,0,0 7 0.7142857142857143
chr1 10487 10488 MCF7_ECACC.nanopolish 7 . 10487 10488 0,0,0 7 0.7142857142857143
chr1 10491 10492 MCF7_ECACC.nanopolish 7 . 10491 10492 0,0,0 7 0.7142857142857143
chr1 10495 10496 MCF7_ECACC.nanopolish 7 . 10495 10496 0,0,0 7 0.7142857142857143
chr1 10523 10524 MCF7_ECACC.nanopolish 8 . 10523 10524 0,0,0 8 0.875
chr1 10540 10541 MCF7_ECACC.nanopolish 11 . 10540 10541 0,0,0 11 0.9090909090909091
chr1 10561 10562 MCF7_ECACC.nanopolish 10 . 10561 10562 0,0,0 10 1.0
chr1 10569 10570 MCF7_ECACC.nanopolish 10 . 10569 10570 0,0,0 10 1.0
```
The `--dss` option yields genome-wide files suitable for input to DSS for statistical assessment of differential methylation (1-based coordinates):
```
chr pos N X
chr1 10468 3 3
chr1 10470 3 3
chr1 10483 6 5
chr1 10488 6 5
chr1 10492 6 5
chr1 10496 6 5
chr1 10524 6 6
chr1 10541 8 7
chr1 10562 8 8
```
### scoredist
Outputs distribution of modified base statistics with current cutoffs for one or more methylartist databases
```
methylartist scoredist -d MCF7_ATCC.megalodon.db,MCF7_ECACC.megalodon.db -m m
```

## Citation
Seth W Cheetham, Michaela Kindlova, Adam D Ewing, Methylartist: tools for visualizing modified bases from nanopore sequence data, Bioinformatics, Volume 38, Issue 11, 1 June 2022, Pages 3109–3112, https://doi.org/10.1093/bioinformatics/btac292